Dashboards
A dashboard is the rendered face of a report: the widgets a report processor emits, laid out as a page someone can read without knowing any FPL. This page covers what a dashboard is made of, the widget types available, how the Scheduled and On-Demand groupings differ, and how to design a dashboard that answers its question at a glance.
What a Dashboard Is
A dashboard is not authored separately from its report: it is the output of a report processor in the Dashboard Reports category, rendered as widgets. If you are arriving from another SIEM, note that there is no drag-and-drop dashboard builder to look for: you change a dashboard by editing the processor behind it.
Dashboards and Report Processors
A dashboard stands in a one-to-one relationship with the processor that produces it: editing the processor is how the dashboard changes.
Where Dashboards Appear
- v2 interface
- Classic v1 interface
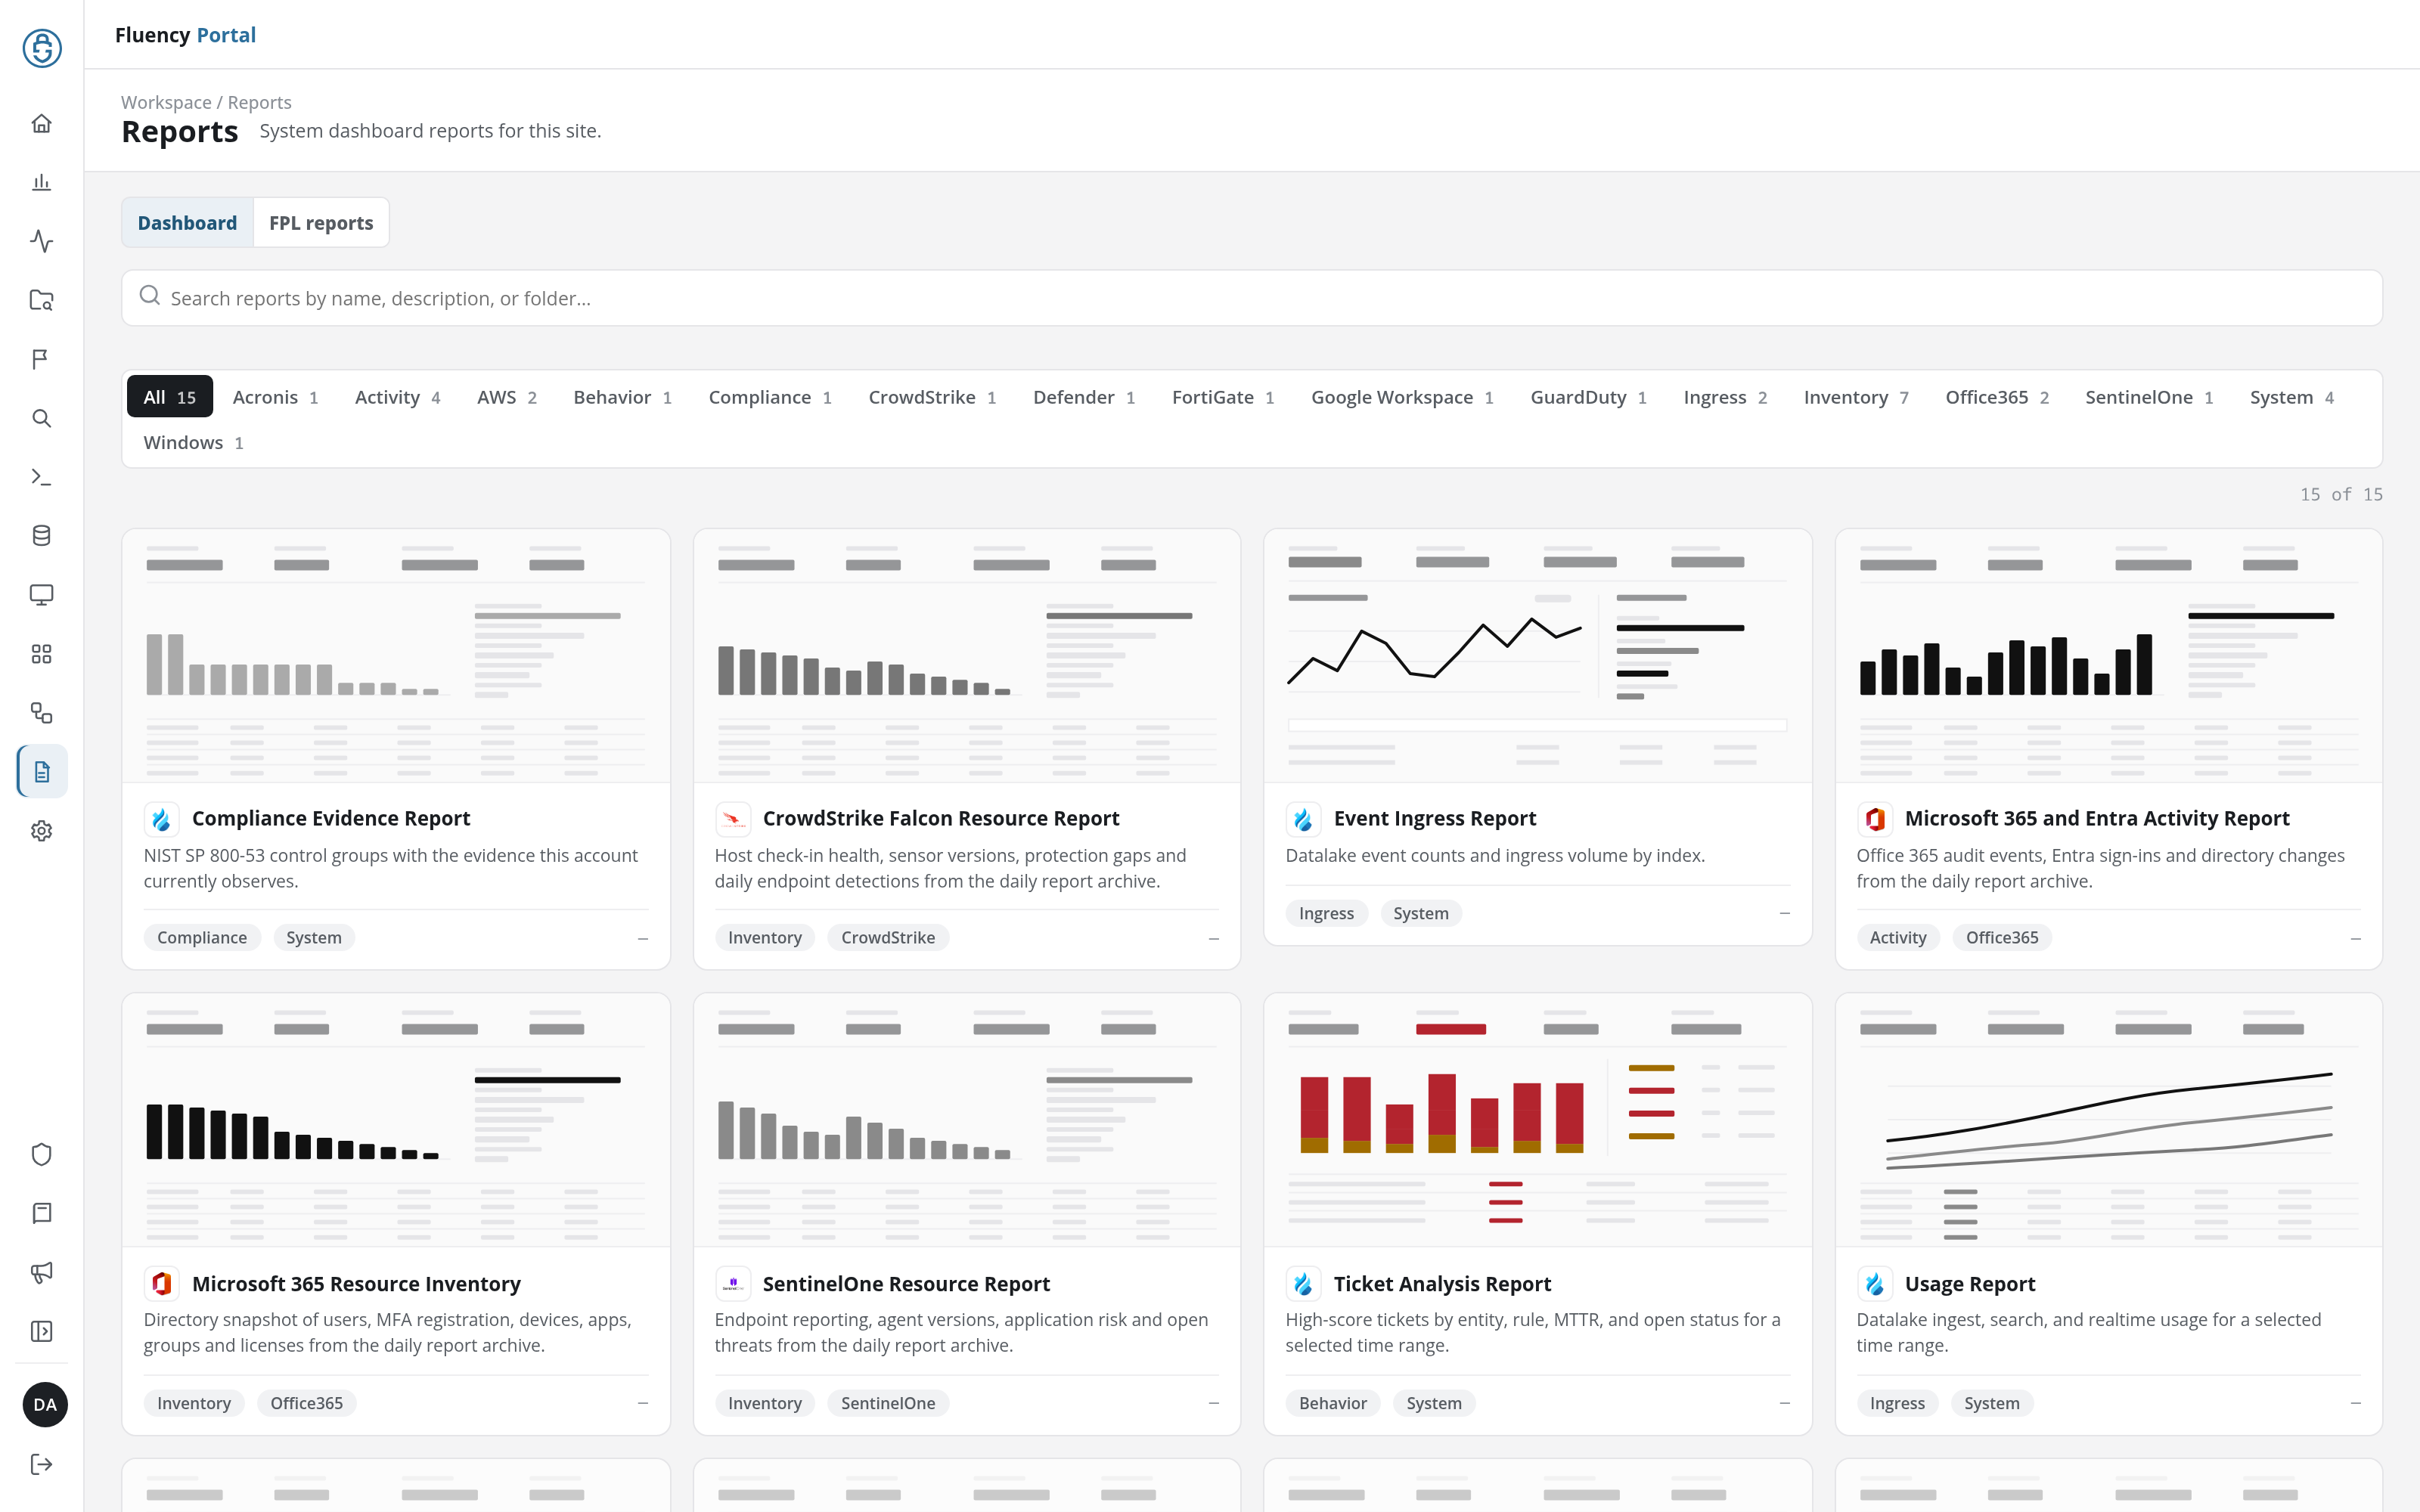
Report dashboards are viewed in the v1 interface, on Reports → Dashboard. The v2 interface's Reports page also opens on a Dashboard tab, but it holds the site's built-in dashboards rather than dashboards rendered from your report processors: the system reports (the Event Ingress Report, the Ticket Analysis Report, the Usage Report, and the Compliance Evidence Report) and dashboards drawn from the daily archive of a scheduled report, such as the Microsoft 365 and Entra Activity Report and the SentinelOne Resource Report. An archive-backed dashboard opens once its scheduled report has archived days for the account; until then its card is greyed out. The full list is on Reports.
The card grid on Reports → Dashboard (/reports/Dashboard), three cards per row, each card titled with the report name and previewing its widgets as thumbnail tiles. Reports that have never run show Report has not been run yet instead of a preview.
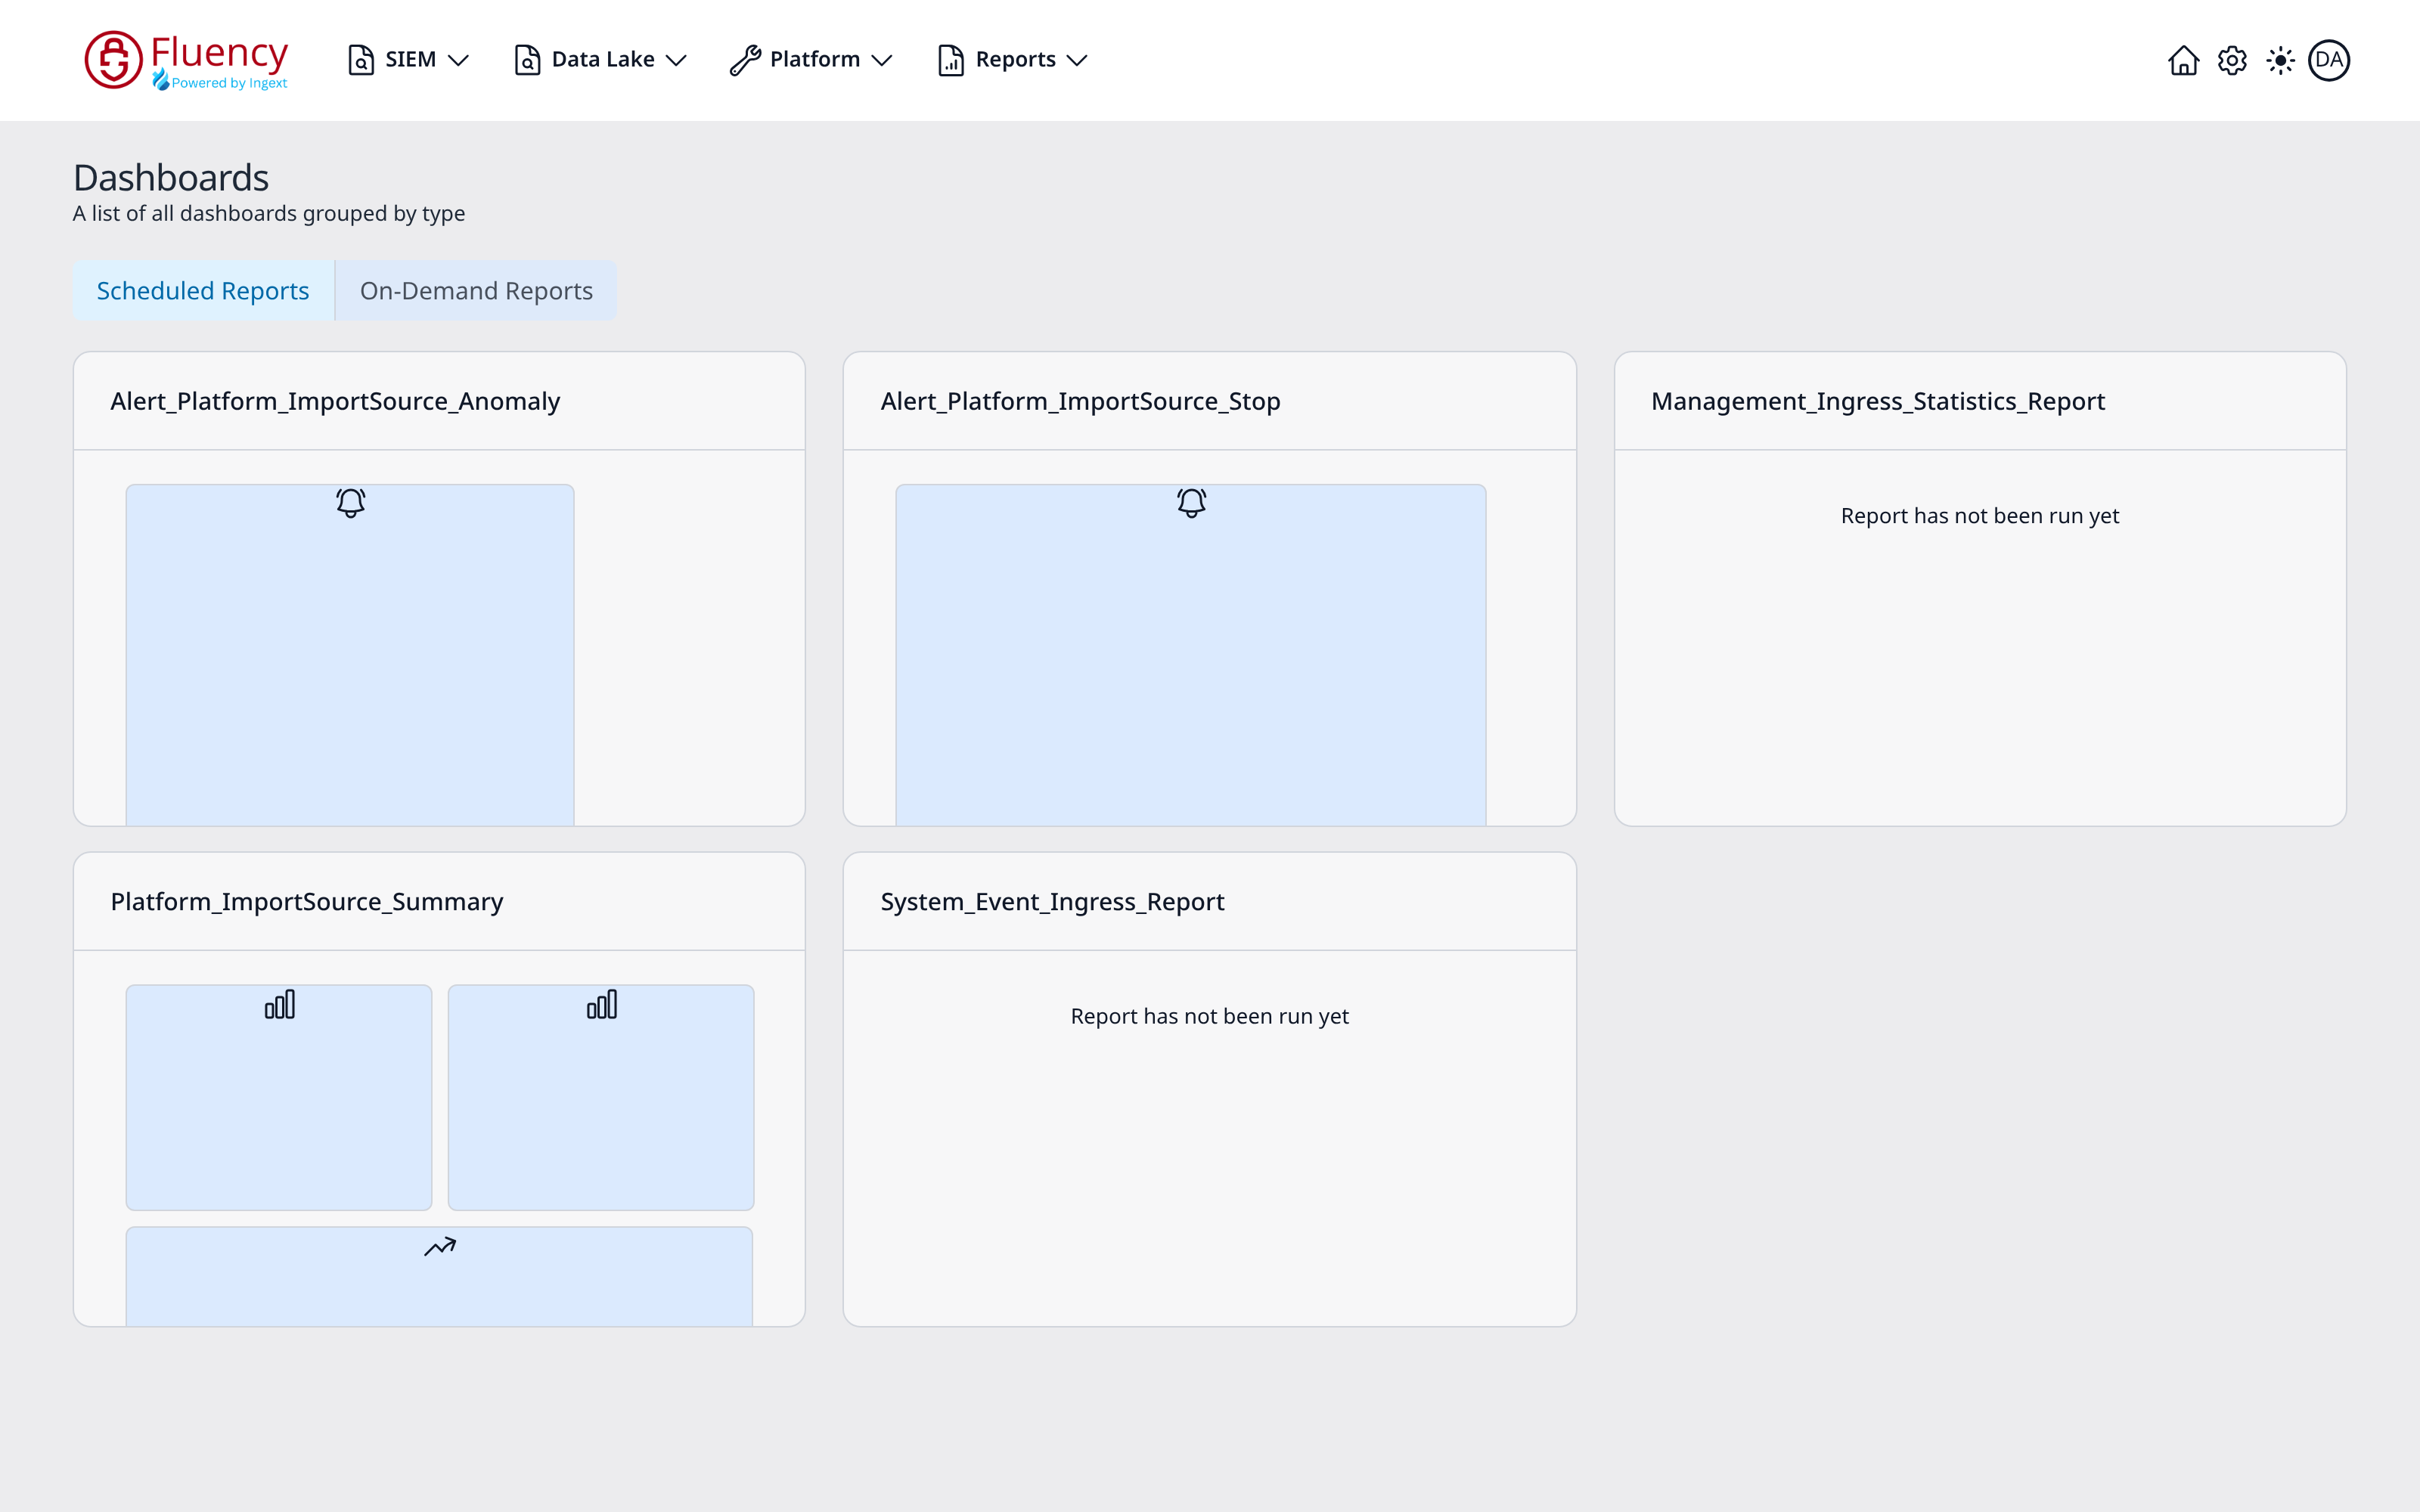
The page header reads Dashboards with the subtitle A list of all dashboards grouped by type, and the two tabs above the grid, Scheduled Reports (selected by default) and On-Demand Reports, switch which group is shown.
Dashboards Elsewhere in the Product
Report dashboards are distinct from the fixed dashboards elsewhere in the interface: the Home landing dashboard and the Overview Summary page (v1: Home and SIEM → Overview Summary), which are not built from report processors and cannot be edited. The built-in dashboards on the Dashboard tab of the v2 Reports page are fixed in the same way.
Scheduled vs. On-Demand
The two tabs that group the dashboard gallery, and the real difference behind them.
Scheduled Reports
Dashboards whose report runs on a recurrence, so the dashboard always shows the most recent scheduled run. The default tab.
On-Demand Reports
Dashboards whose report is run manually, typically with arguments supplied per run: an investigation report scoped to one user, for example. The displayed content reflects whoever ran it last, with whatever arguments they chose, which is a trap if the dashboard is shared.
Choosing Between Them
The decision rule: recurring operational and executive reporting is scheduled; per-subject investigation is on demand.
Related
- Reports: how reporting works end to end
- Creating a Report: authoring the processor behind a dashboard
- Scheduling and Delivery: keeping a dashboard fresh
- Report Cookbook: worked examples that emit widgets
- Page Functionality → Dashboard: the v1 gallery page, control by control
- Home: the fixed landing dashboard (v1: Home)