Overview Summary
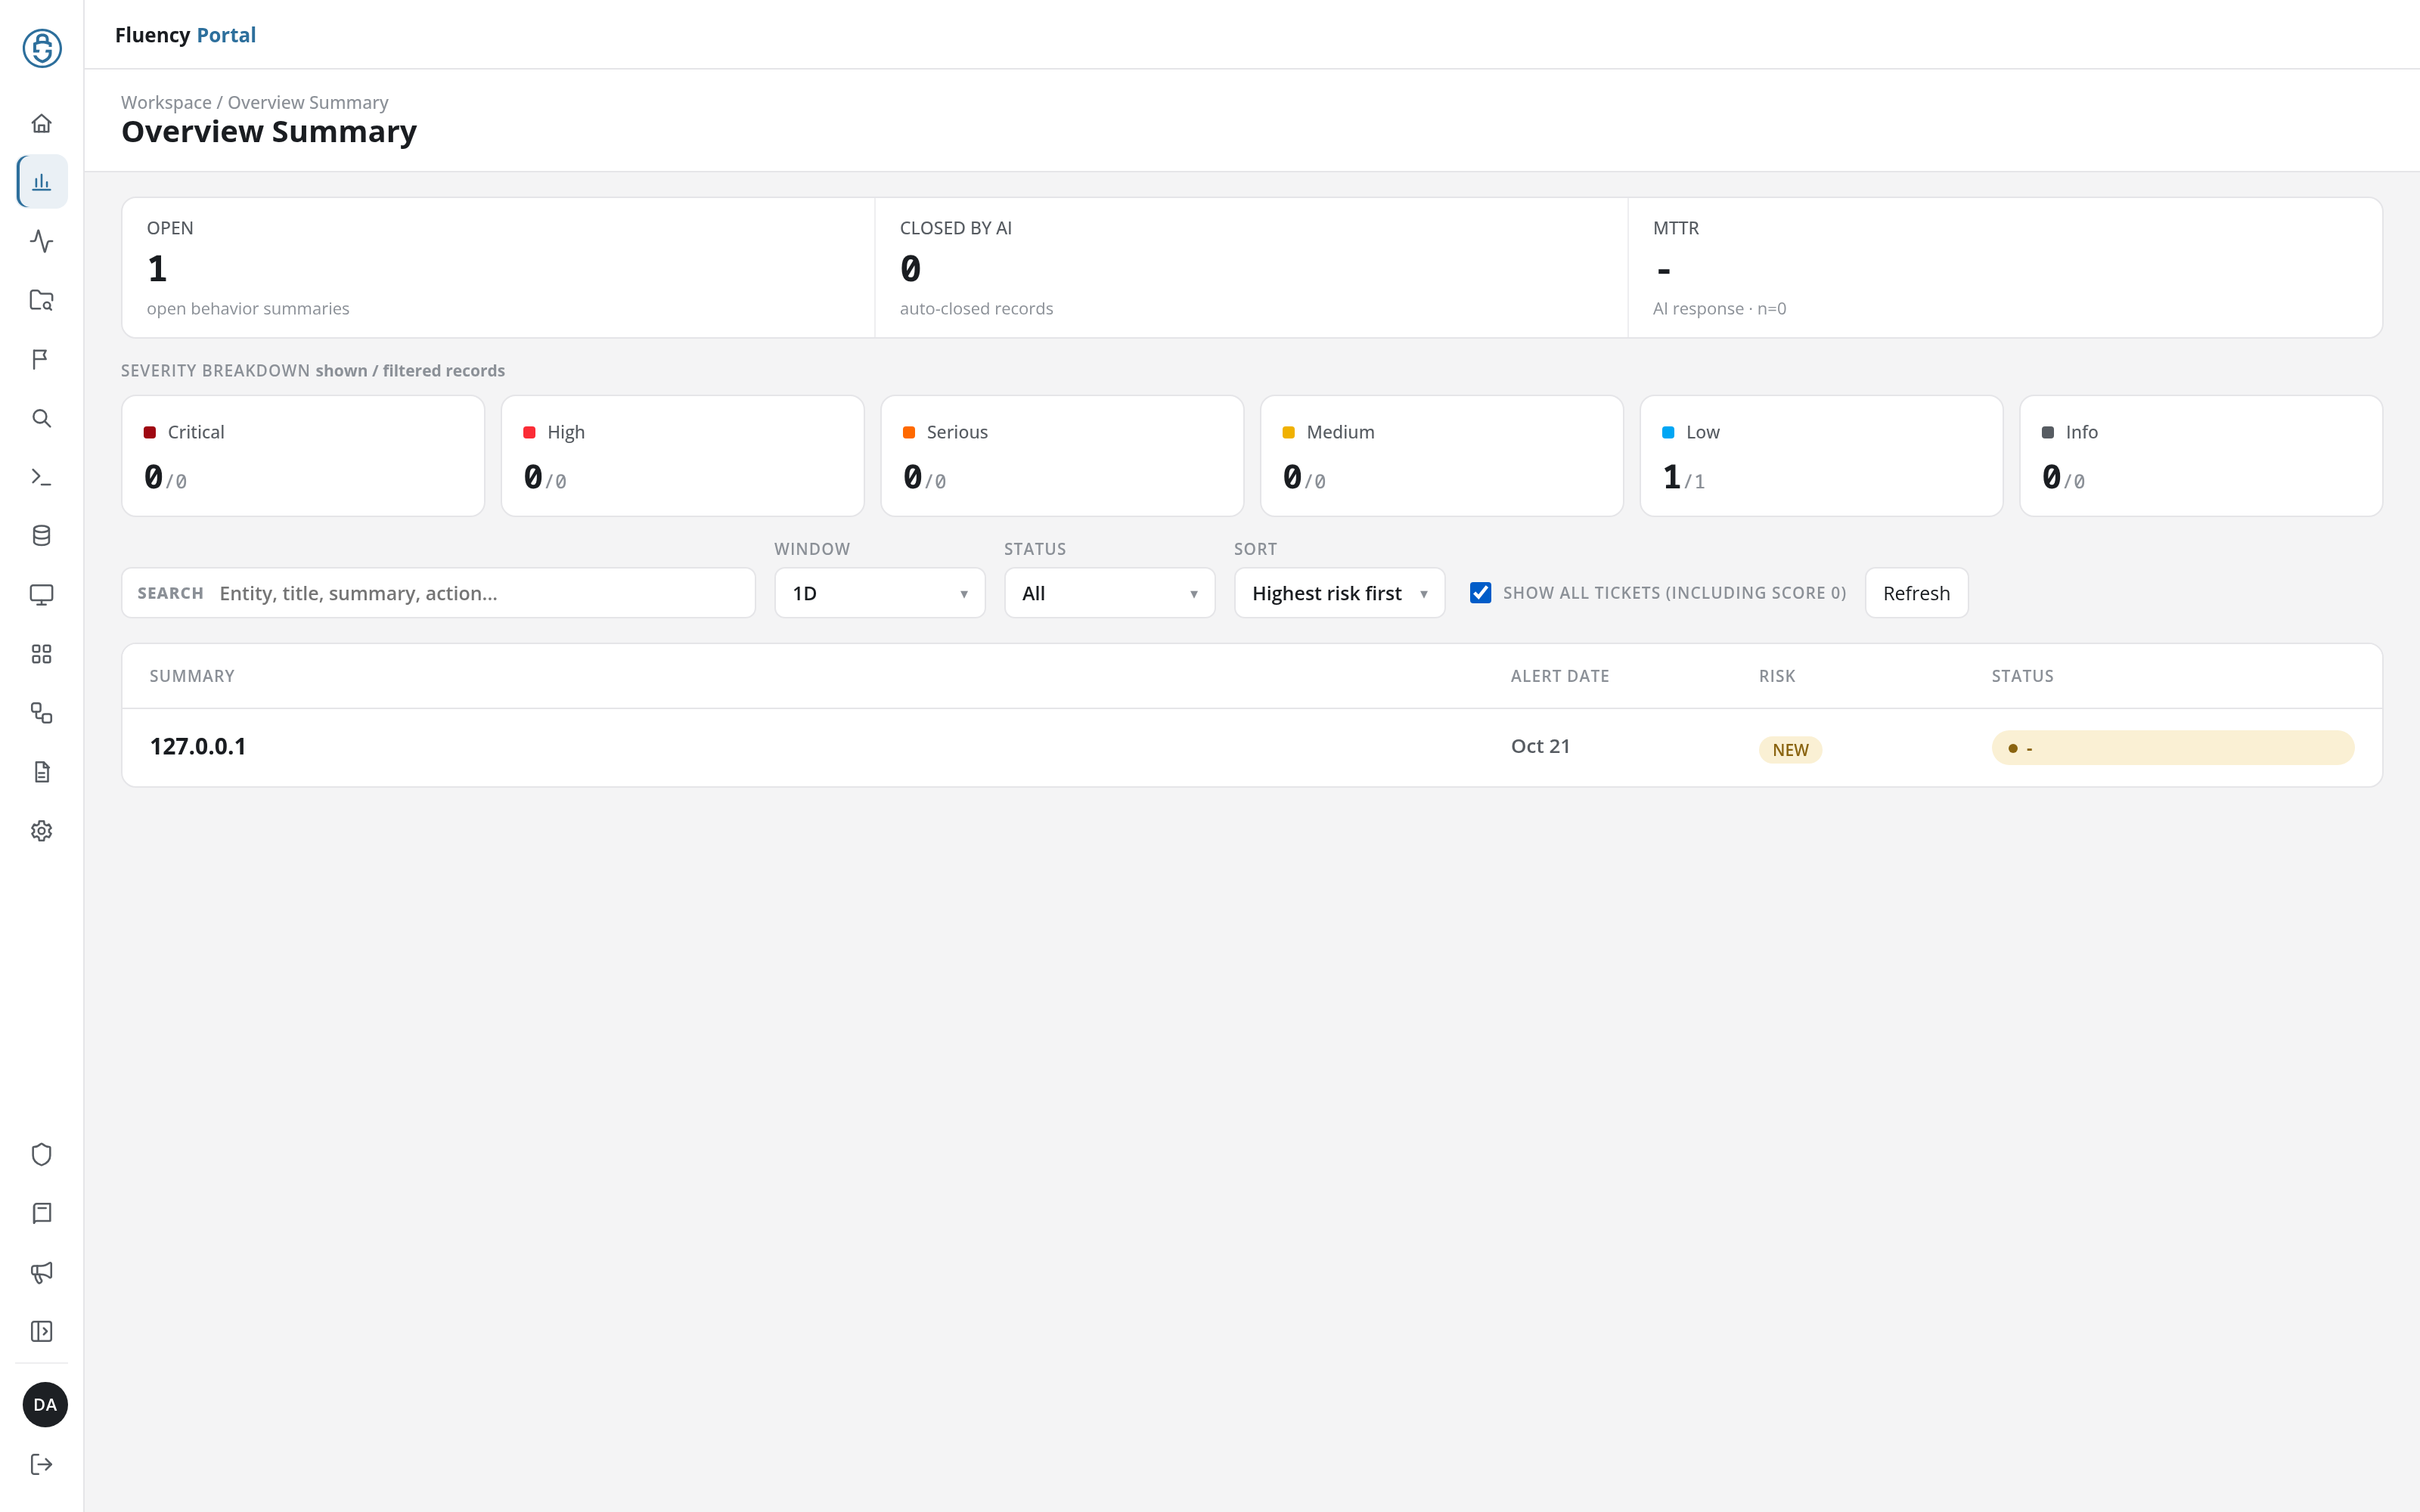
The Overview Summary page is a dashboard of the account's behavior summaries: how many are open, how many the AI closed, how quickly they are answered, and how they divide by severity. Below the counters, a search, a filter bar and a list show the summaries themselves.
Menu path: Overview Summary · URL path: /v2/overview-summary
Page Layout
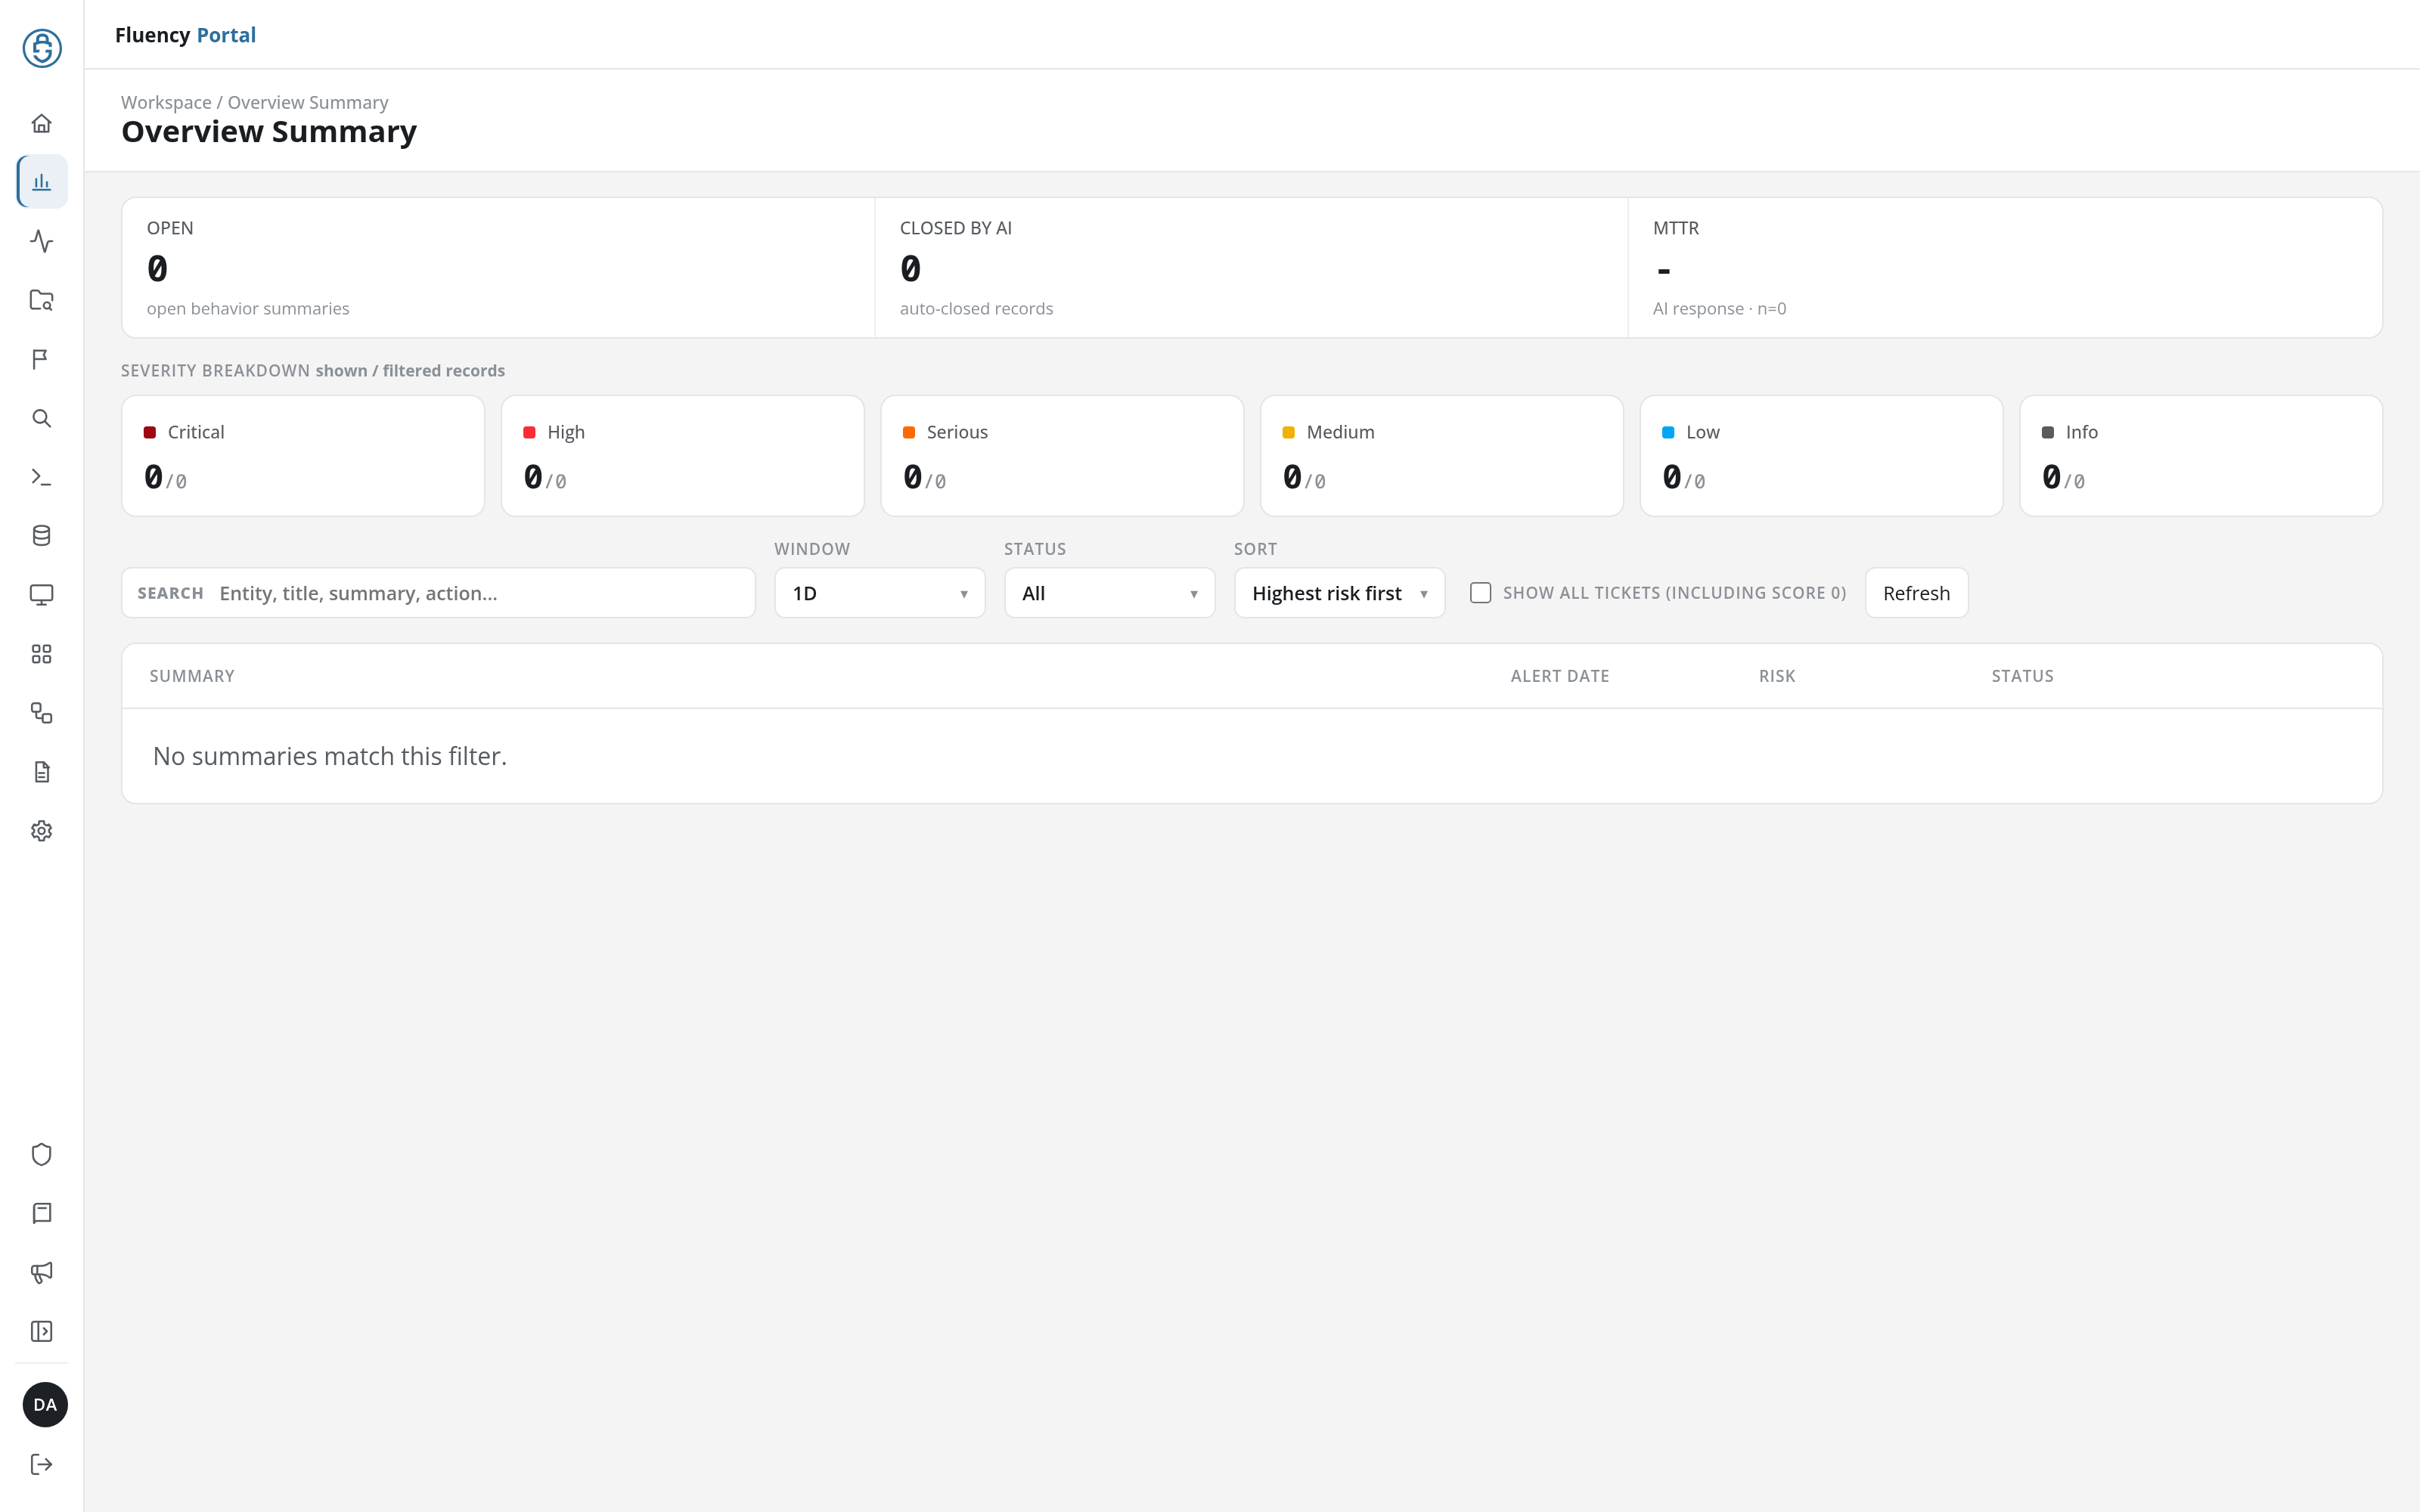
The header shows the breadcrumb Workspace / Overview Summary and the title Overview Summary. Below it, from top to bottom:
- Counters: OPEN, CLOSED BY AI and MTTR.
- Severity breakdown: one tile per severity level.
- Filter bar: Search, Window, Status, Sort, Show all tickets (including score 0) and Refresh.
- Summary list: a table of the summaries that match the filters.
Counters
| Counter | What it shows |
|---|---|
| OPEN | The number of open behavior summaries. |
| CLOSED BY AI | The number of records closed automatically by the AI. |
| MTTR | The mean time to respond, measured on AI responses. The line beneath it gives the number of responses it is based on (AI response · n=0); with none, the counter shows a dash. |
Severity Breakdown
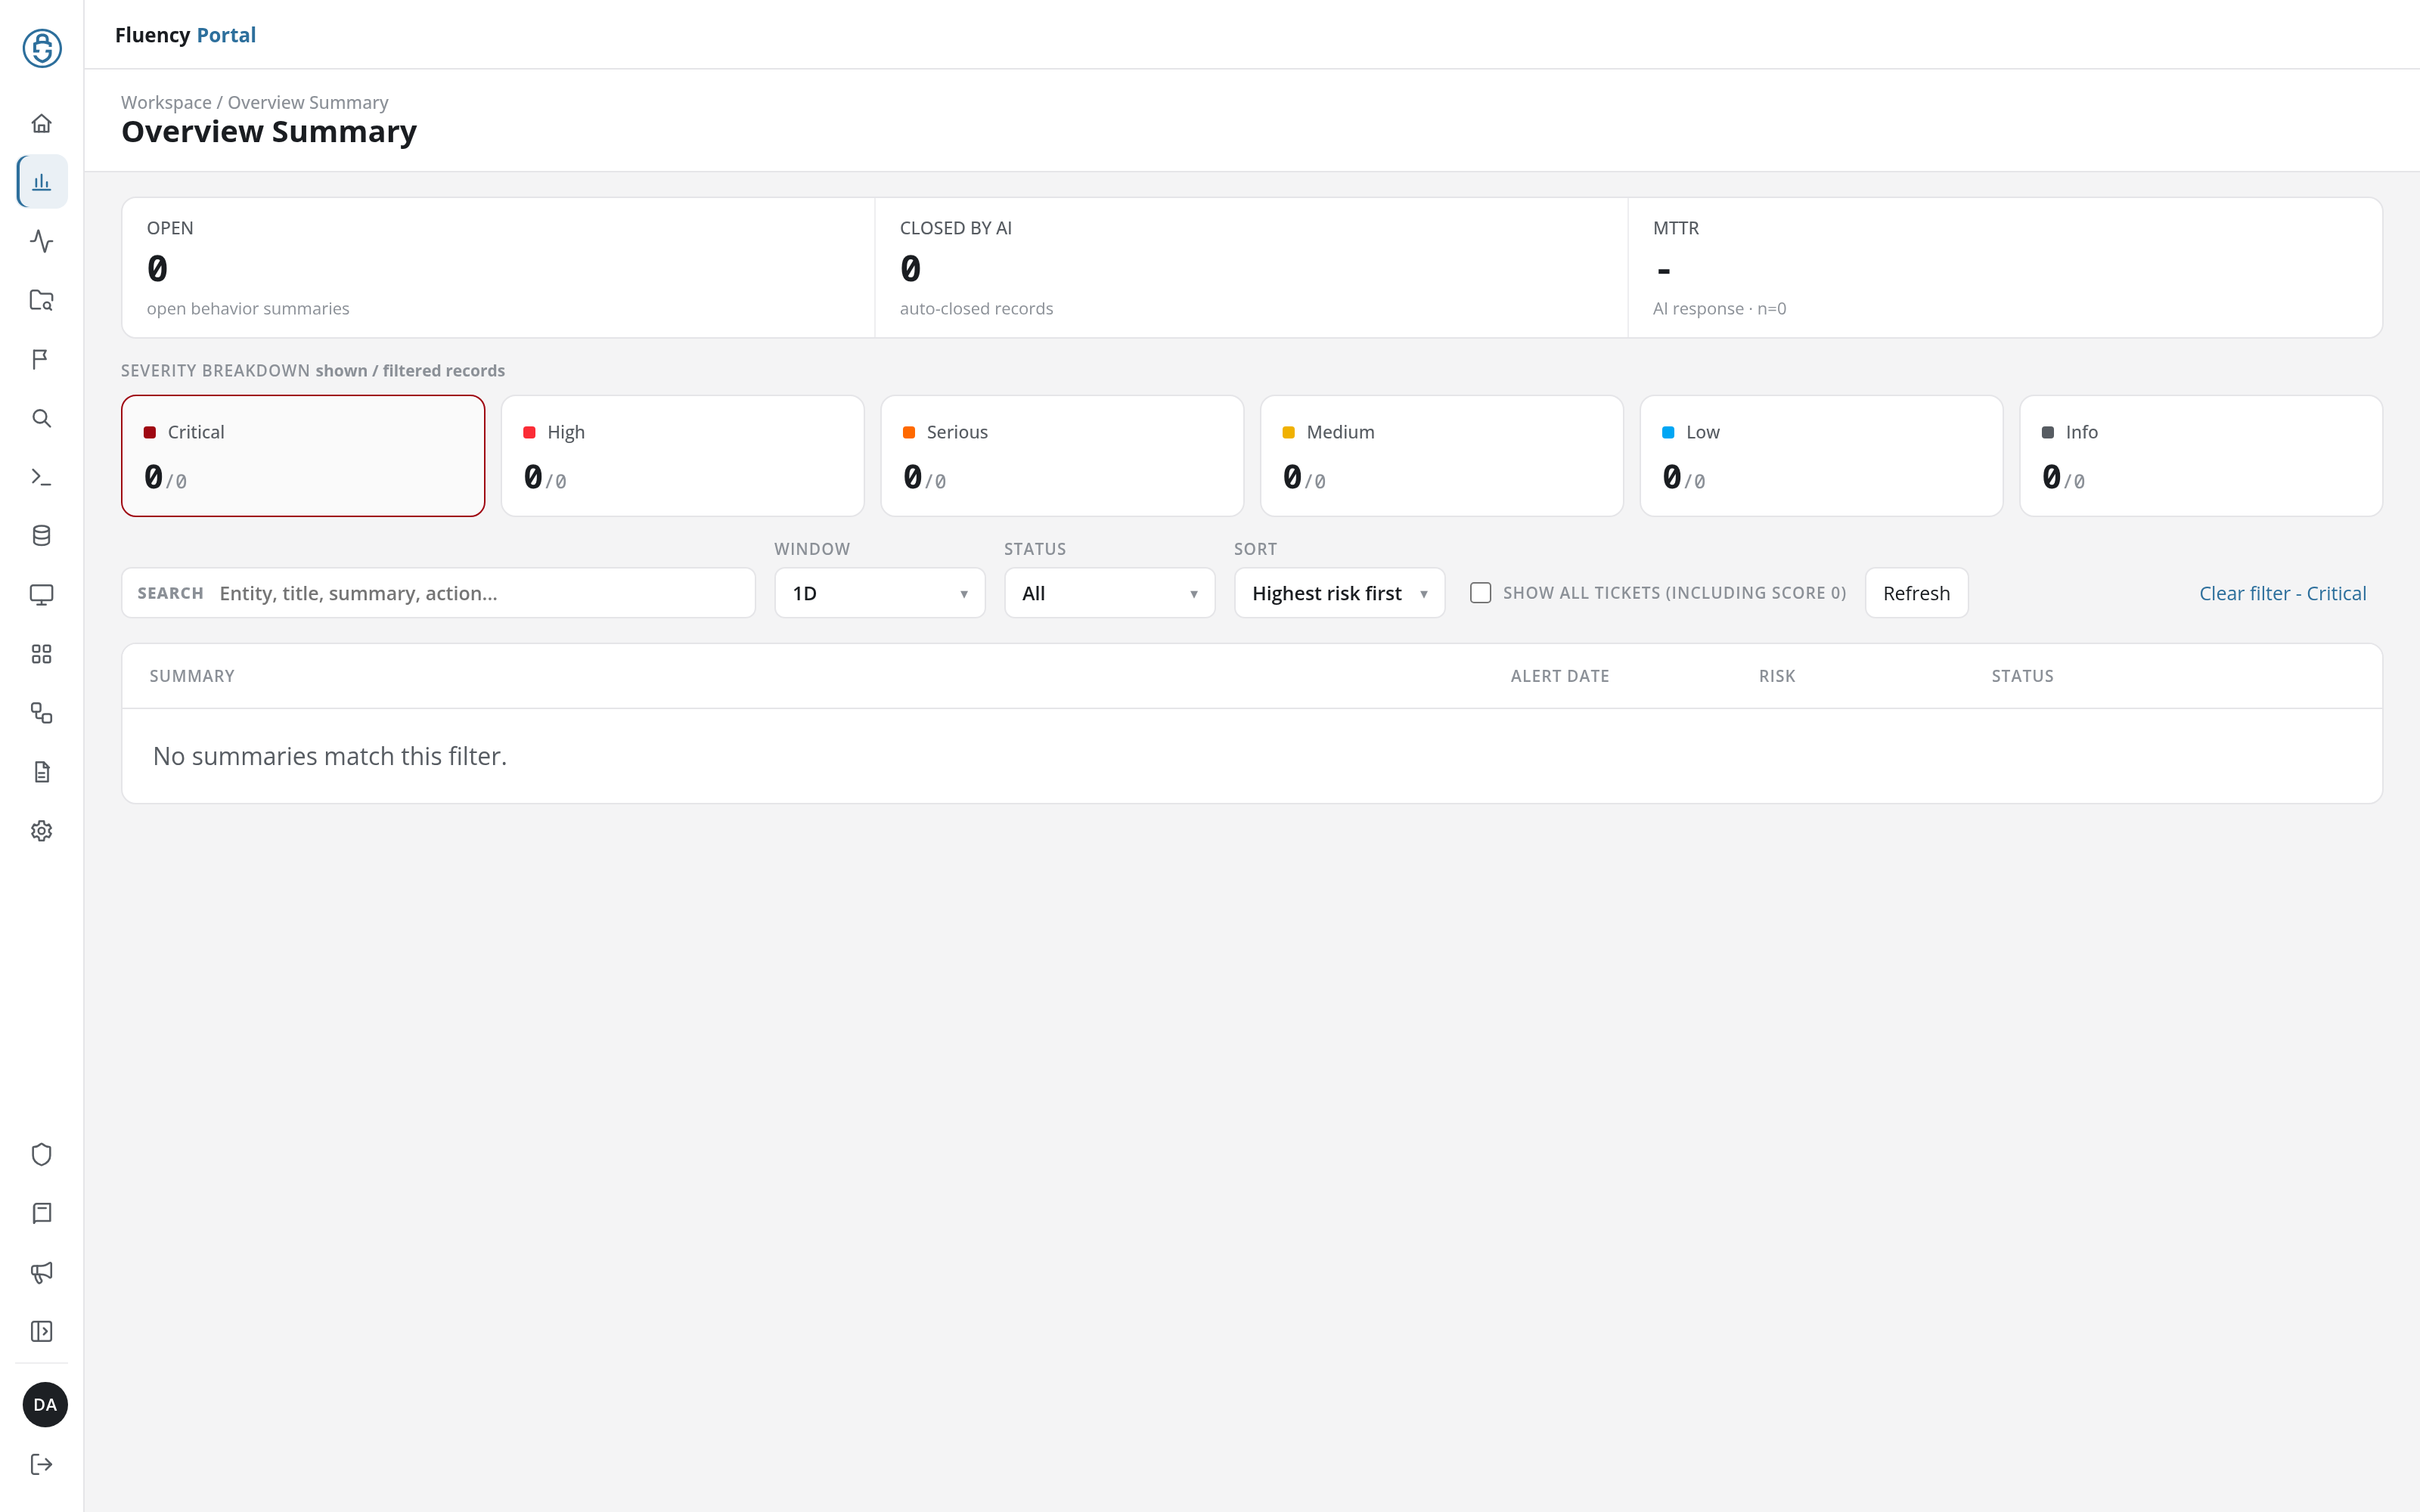
The row headed SEVERITY BREAKDOWN shown / filtered records has one tile per severity level, each marked with its colour:
- Critical
- High
- Serious
- Medium
- Low
- Info
Each tile gives two numbers: the records of that severity shown in the list, and, after the slash, the number of records that match the filters, of every severity.
Click a tile to narrow the list to that severity. The tile is outlined to show it is selected, and a Clear filter - Severity link appears at the right end of the filter bar; click the link to show every severity again.
Filter Bar
- Search: a search field (Entity, title, summary, action...) that narrows the list to the summaries whose entity, title, summary or required action contains the text. It works on the summaries already loaded for the window, without loading them again, and the counters and severity tiles follow it. The × at its right end clears it.
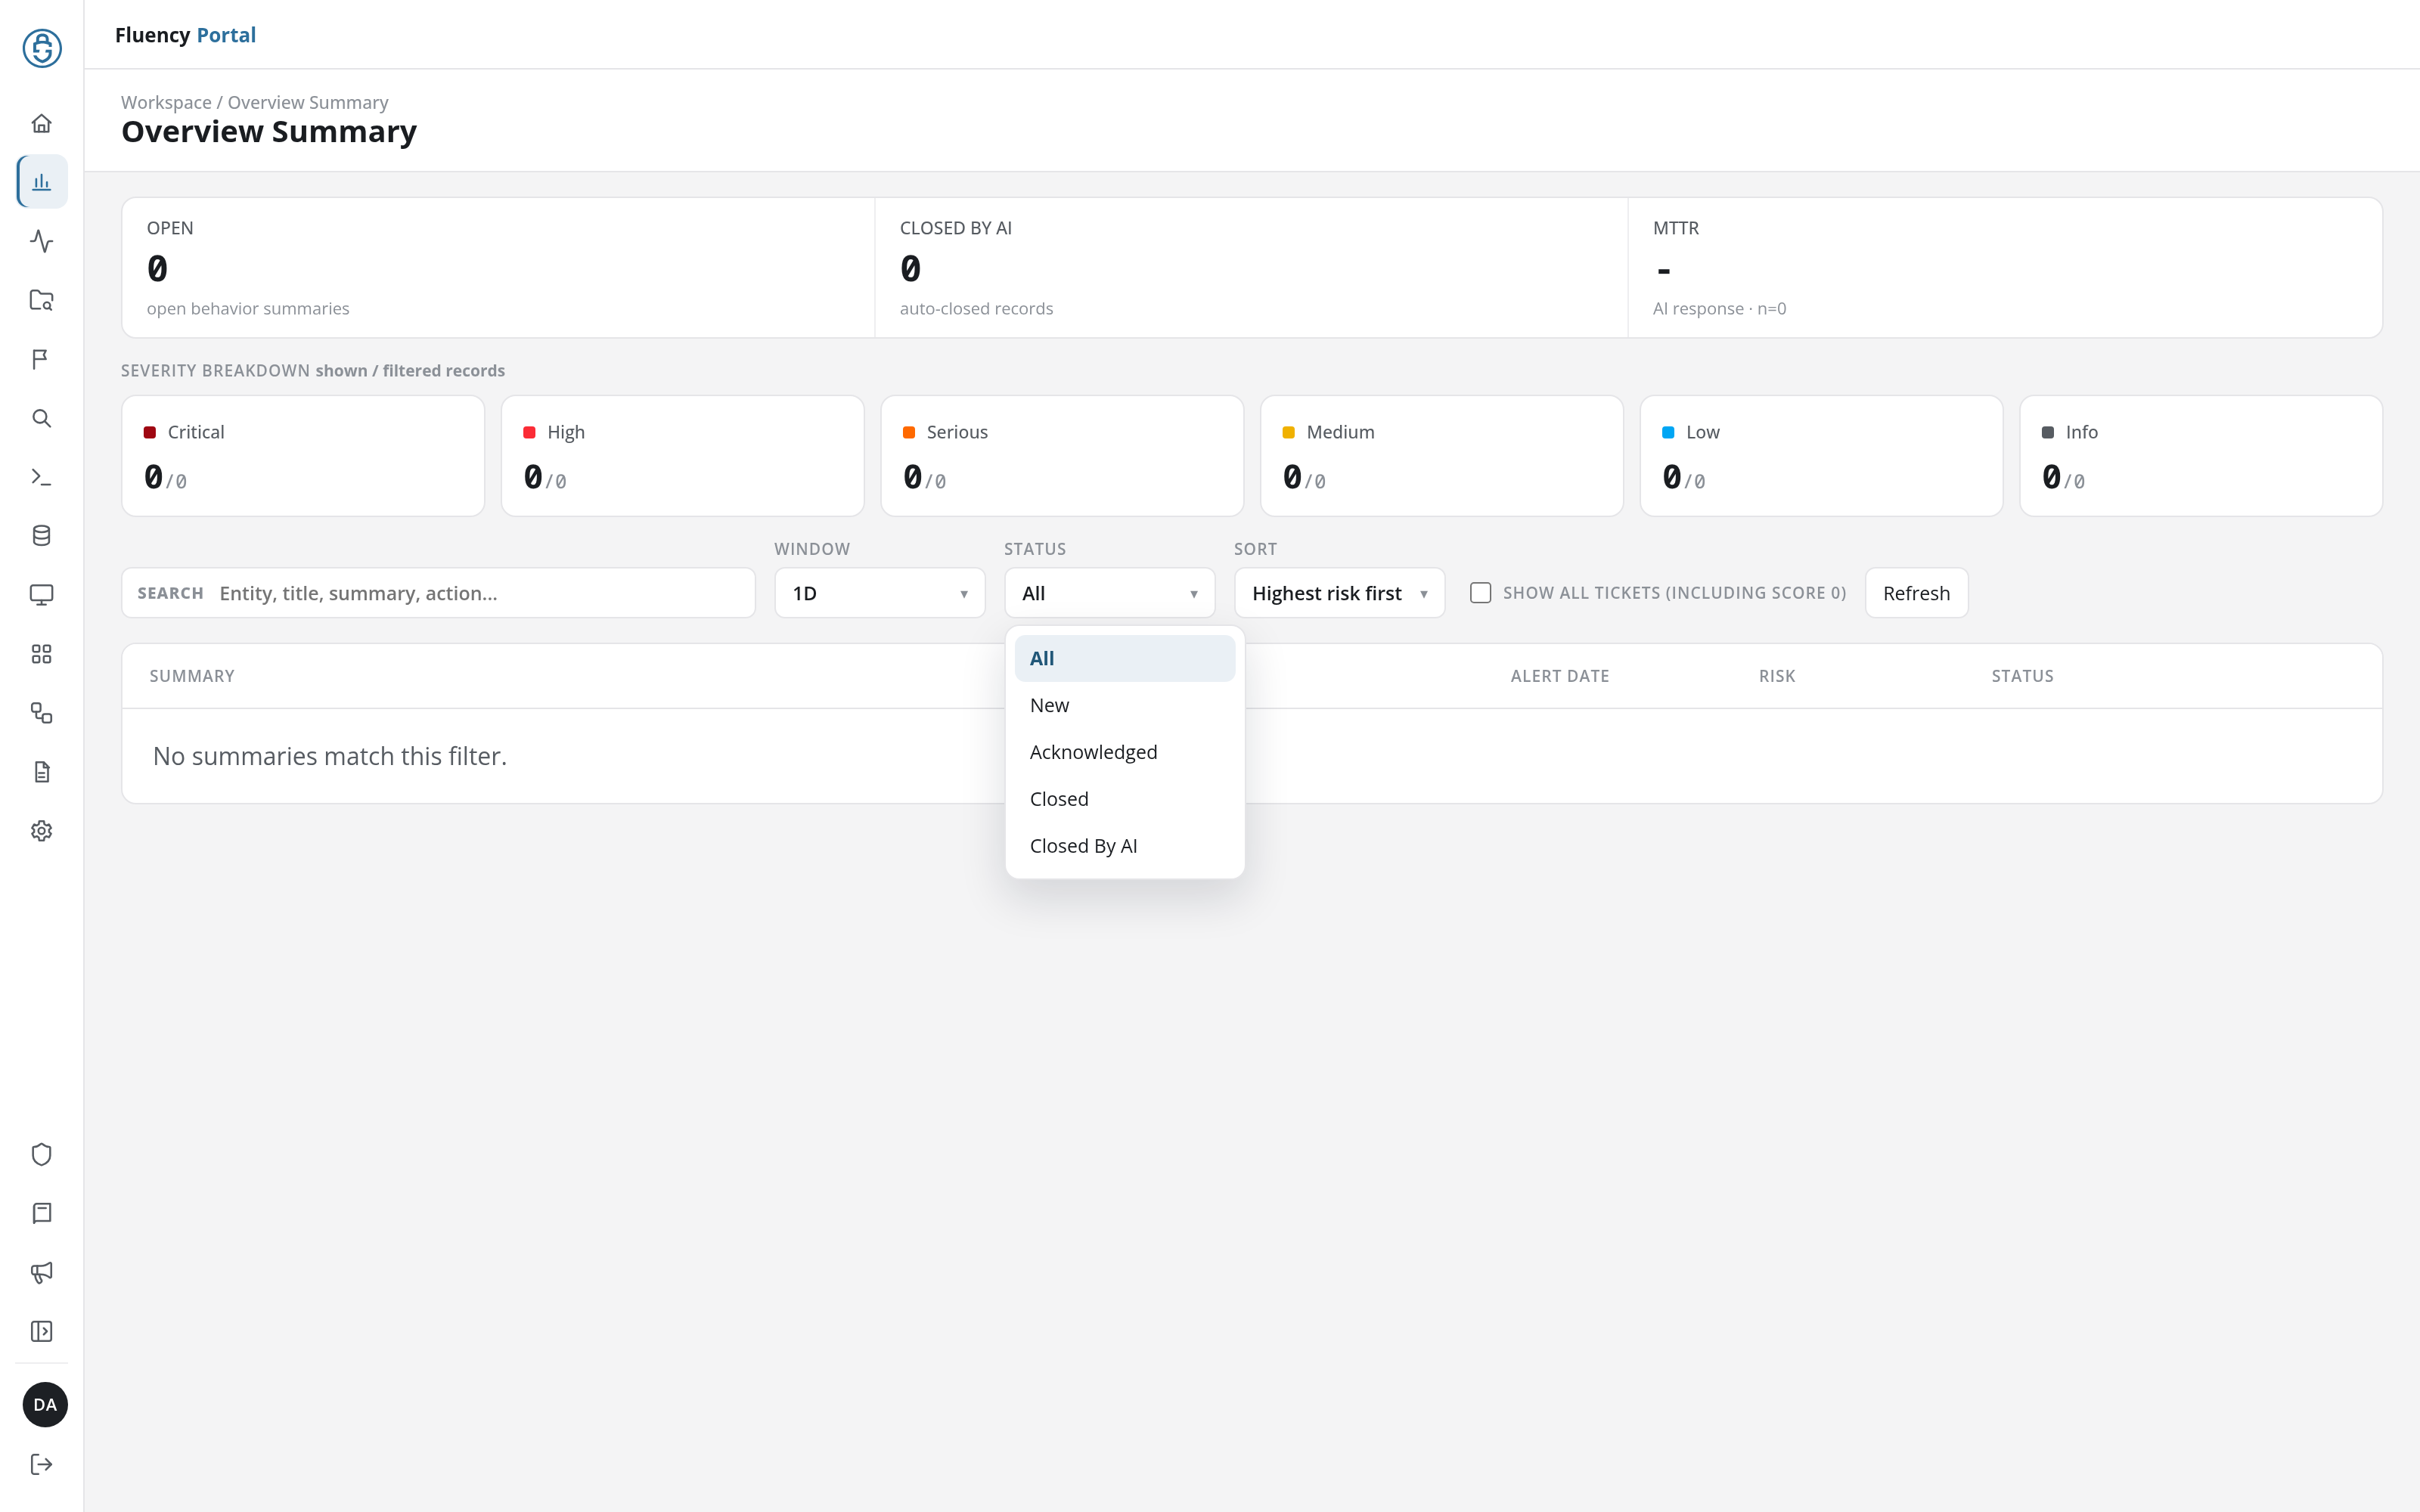
- Window: the period the page covers: 1D (the default), 3D, 7D, 30D, 90D or ALL TIME.
- Status: which summaries to list: All (the default), New, Acknowledged, Closed or Closed By AI.
- Sort: the order of the list: Highest risk first (the default: by severity, then by risk score), Newest first, or New / unclosed first.
- Show all tickets (including score 0): a checkbox, unticked by default. Unticked, the page holds only the summaries with a risk score of 3,000 or more, the notification threshold; ticked, it holds every summary in the window, whatever its score, down to zero.
- Refresh: reloads the counters and the list.
Status works on the summaries already loaded for the window, like Search: the list, the tiles and the OPEN counter follow it at once.
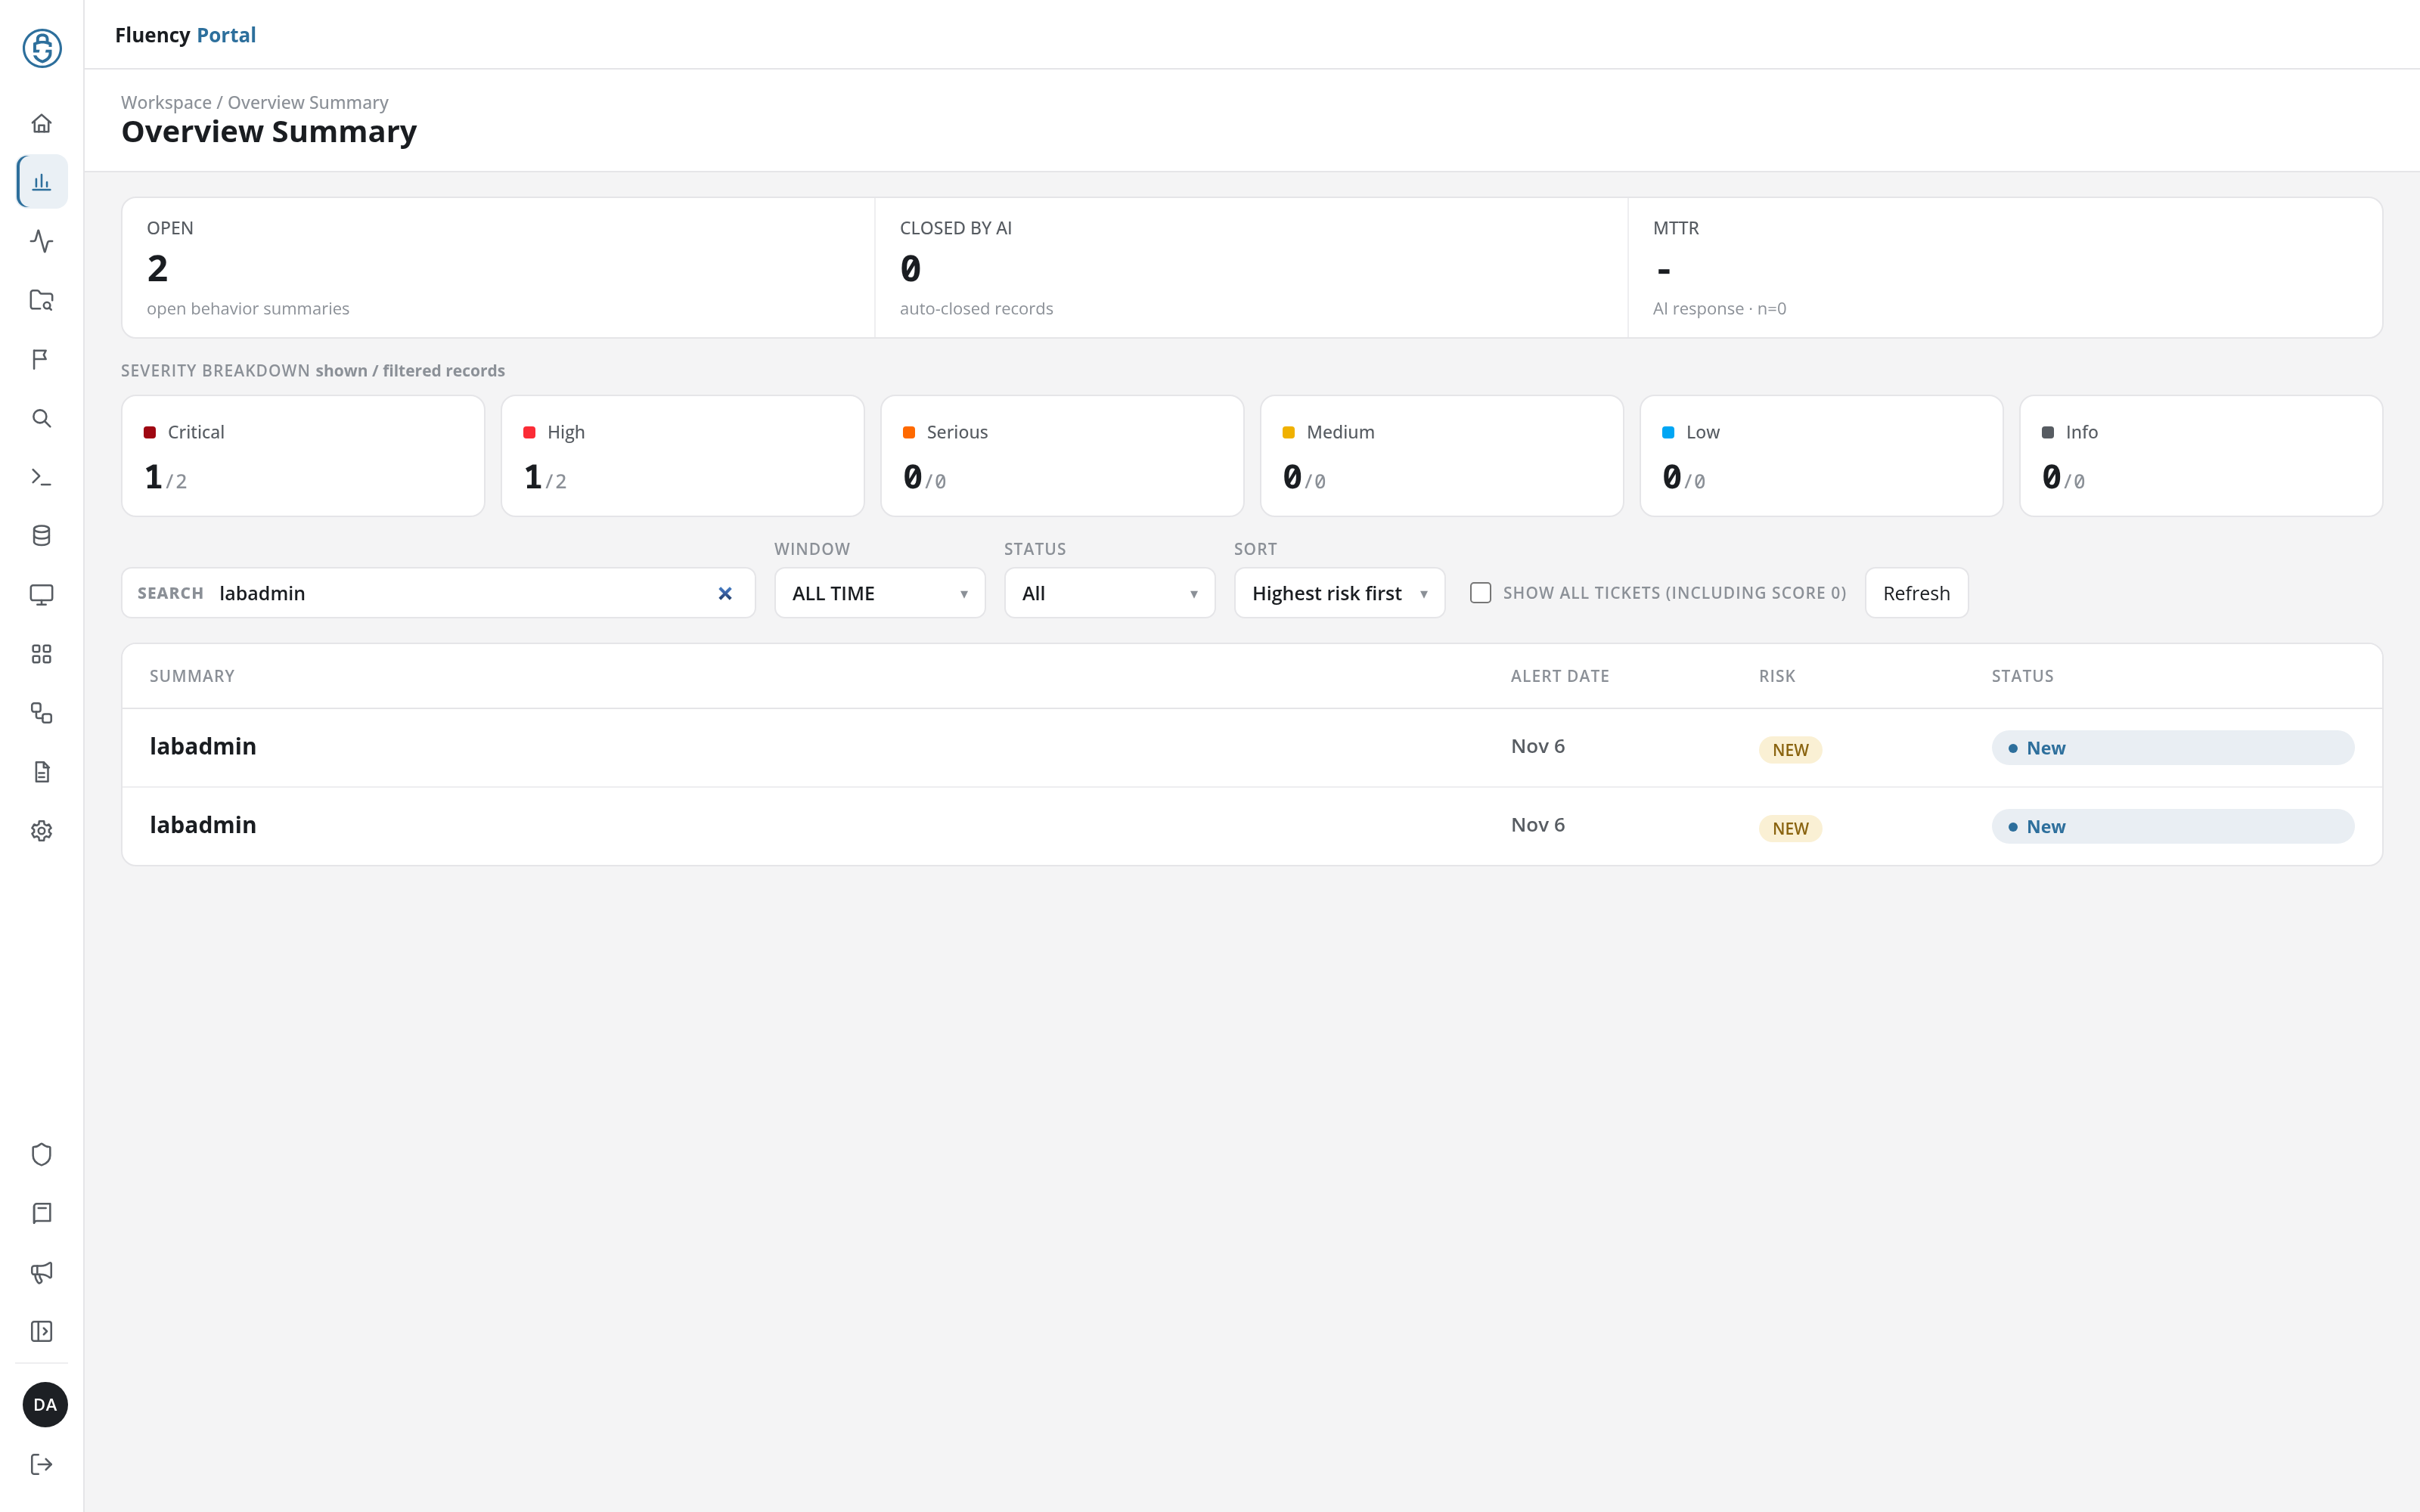
Summary List
The table lists the summaries that match the filters, with the columns SUMMARY (the entity), ALERT DATE (the summary's day), RISK (the severity as a badge, with the score beneath it; NEW for a summary the AI has not analysed yet) and STATUS (the status, such as New; a summary below the threshold shows -). Click a summary to open it on Behavior Summary, for that entity and day. When nothing matches, it reads No summaries match this filter.
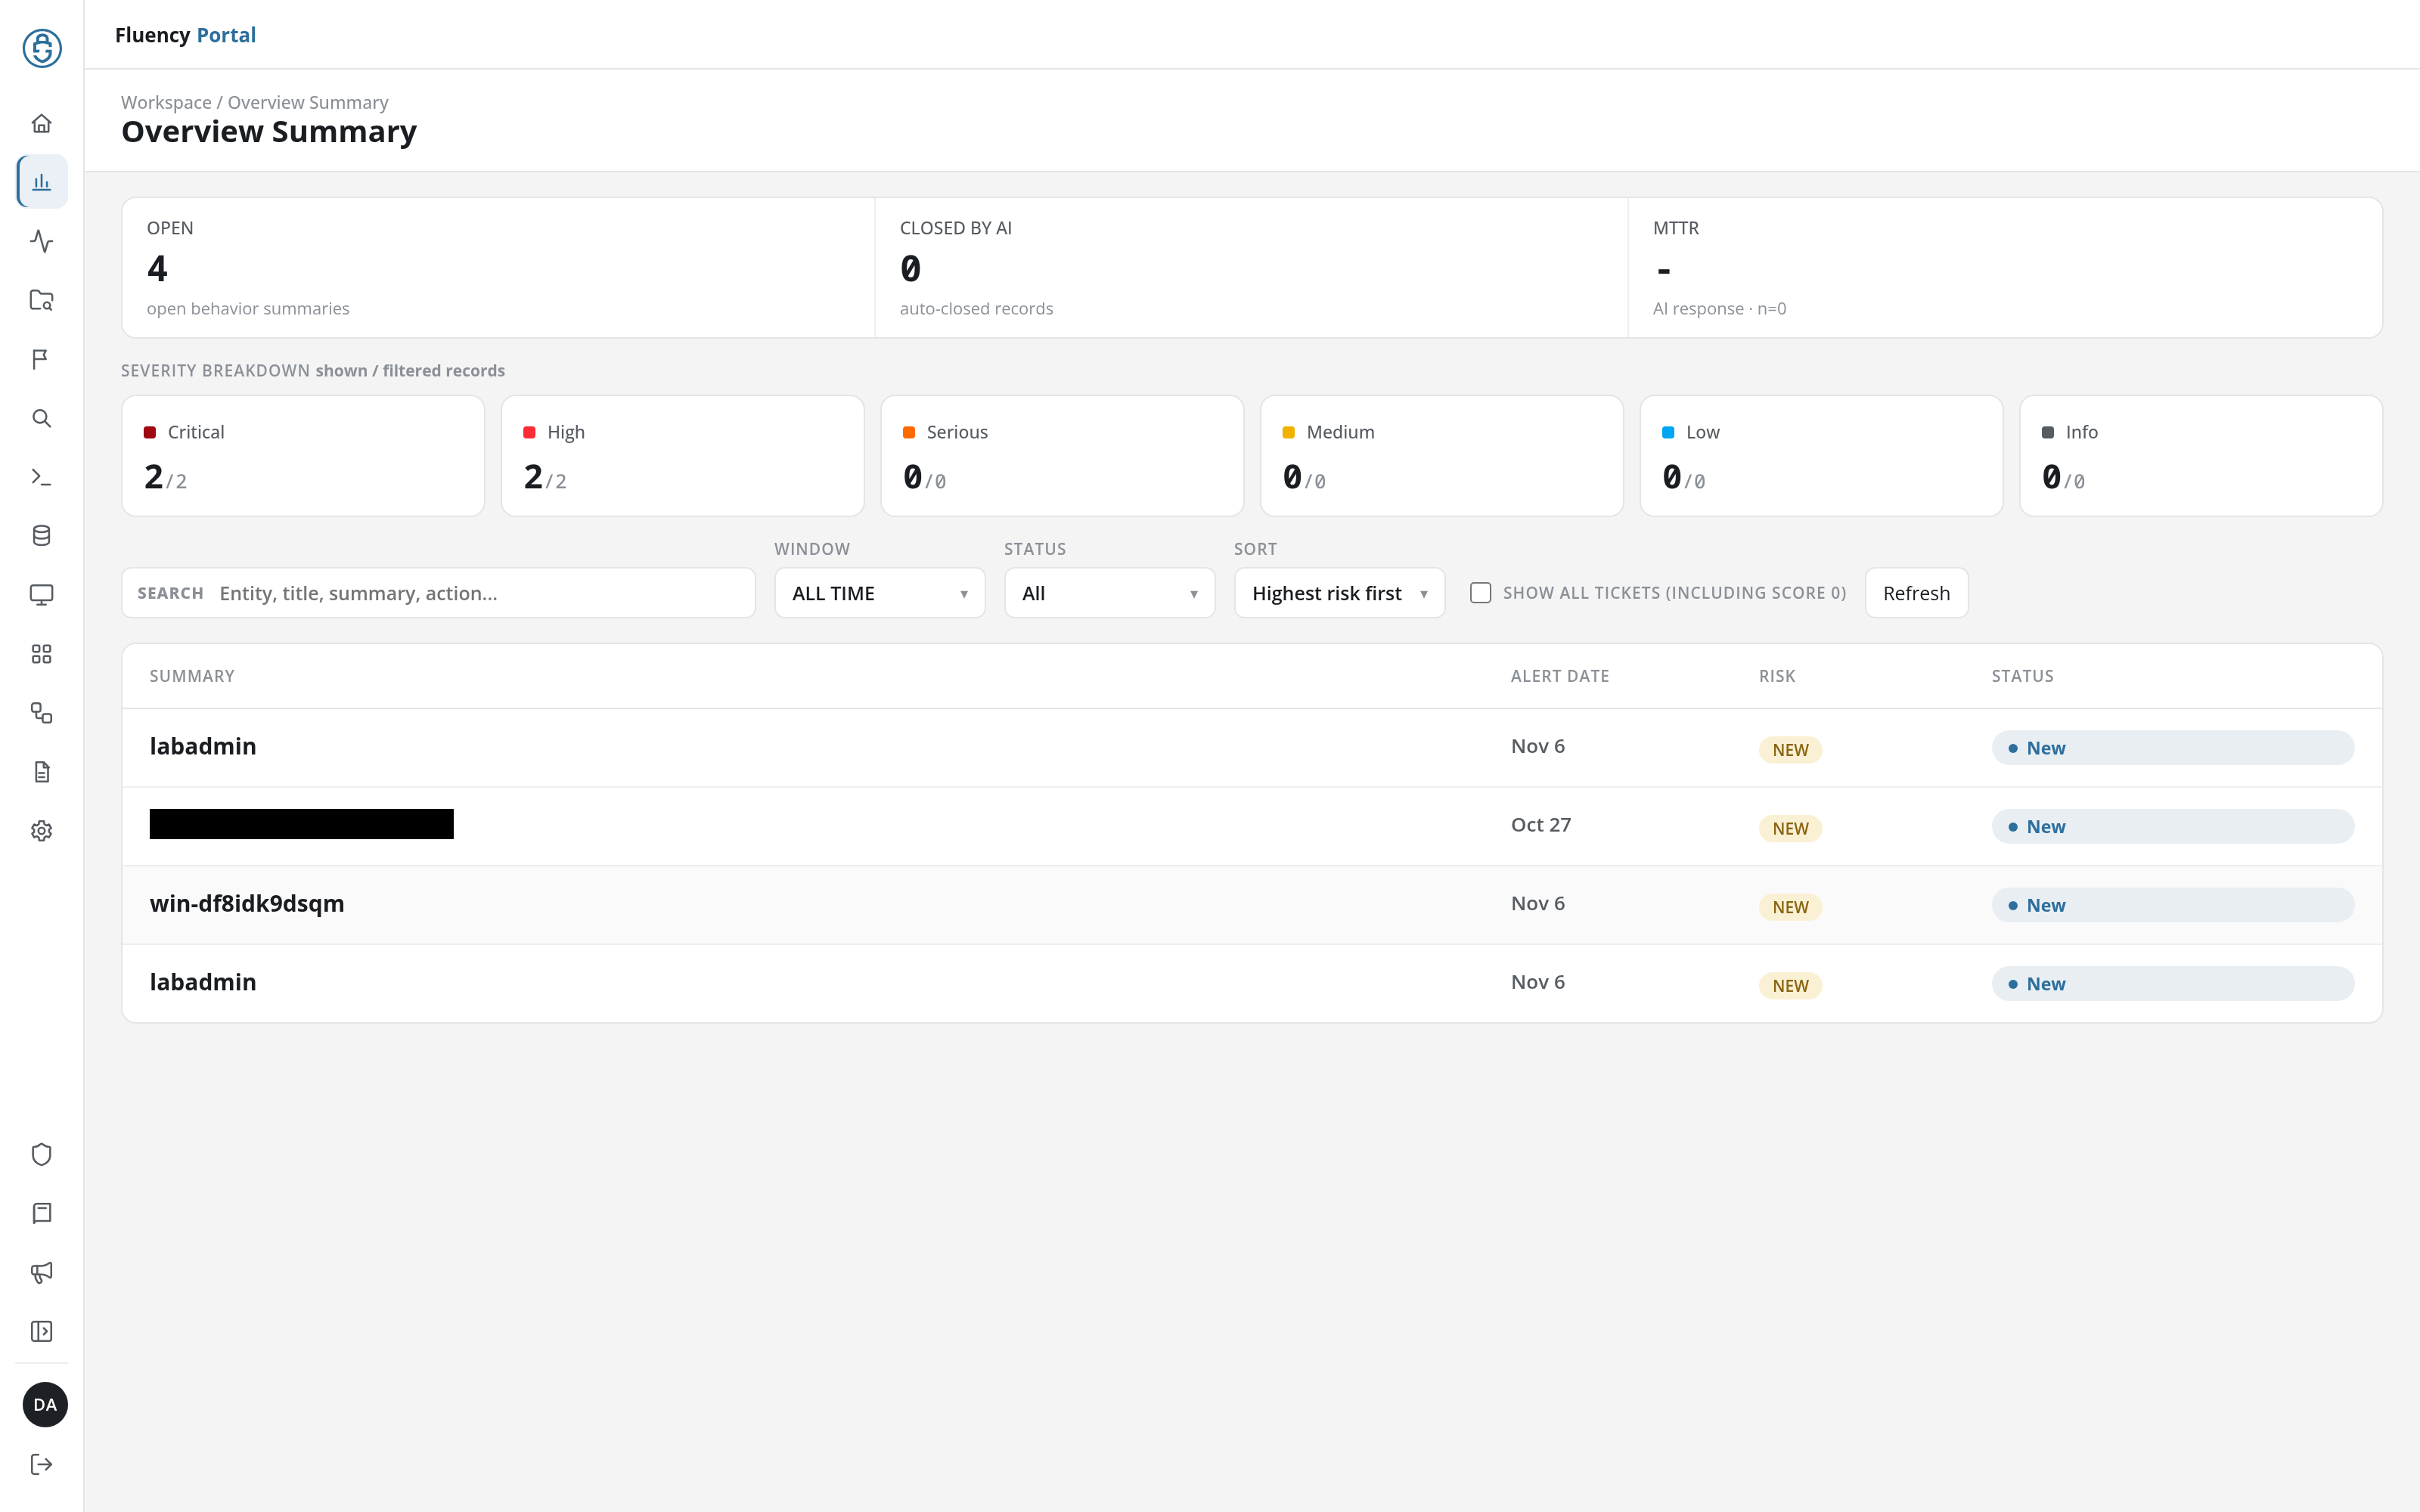
With Show all tickets (including score 0) ticked, summaries below the threshold join the list, with - as their status: