Reports
The Reports page holds two kinds of report. Dashboard reports are the site's built-in reports, each opening as an interactive dashboard: the system reports (event ingress, ticket analysis, usage, and compliance evidence), and dashboards drawn from the daily archive of a scheduled report, for products such as Microsoft 365 and Entra ID, CrowdStrike Falcon, and SentinelOne. FPL reports are report processors written in FPL, the platform's processing language, which you can open, run, and save in an editor on this page.
Menu path: Reports · URL path: /v2/reports (Dashboard; /v2/reports?kind=dashboard opens it too) · /v2/reports?kind=fpl (FPL reports)
Task guide: Creating a Report: writing, running, and saving an FPL report.
Page Layout
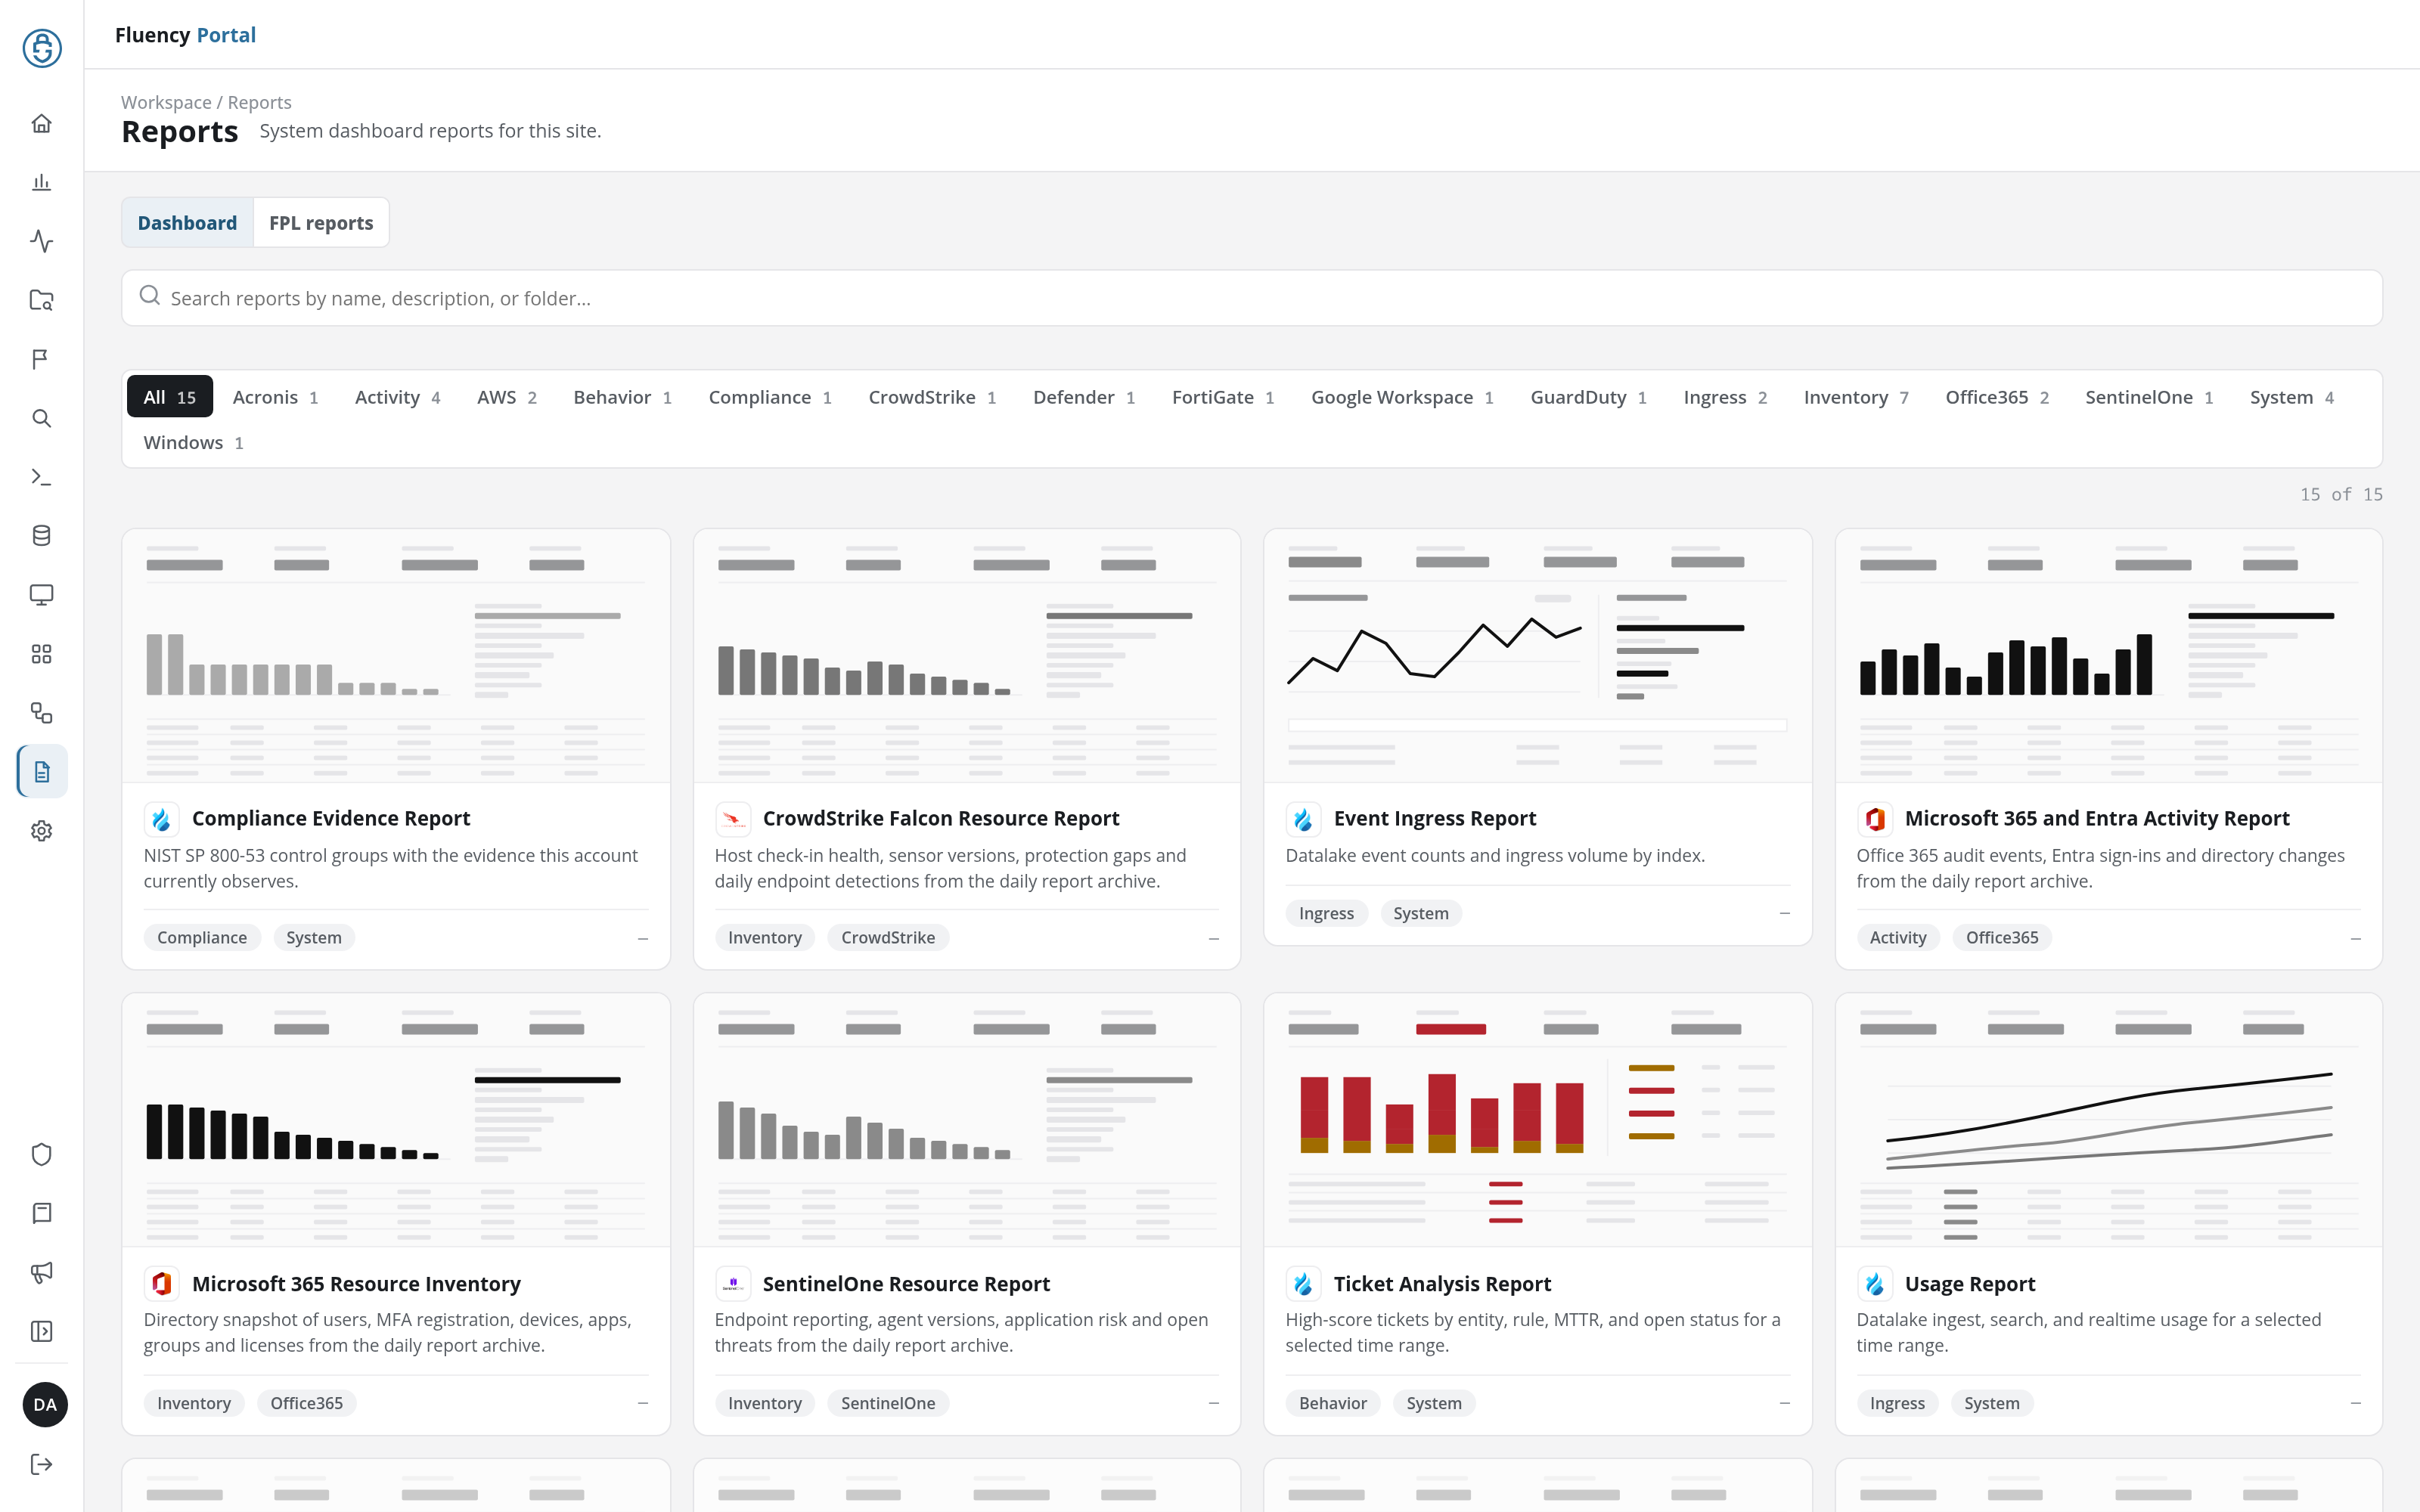
The header shows the breadcrumb Workspace / Reports and the title Reports, with a subtitle naming the current tab. Below it:
- Tabs: Dashboard (the default) and FPL reports.
- Search field: across the full width: Search reports by name, description, or folder… on the Dashboard tab, and Search reports by name, description, folder, or FPL script… on the FPL reports tab.
- Filter bar: filter buttons, each with a count of the reports it holds, and, on the right, how many reports are shown out of the total (for example 15 of 15).
- Report list: cards on the Dashboard tab, a table on the FPL reports tab.
Dashboard
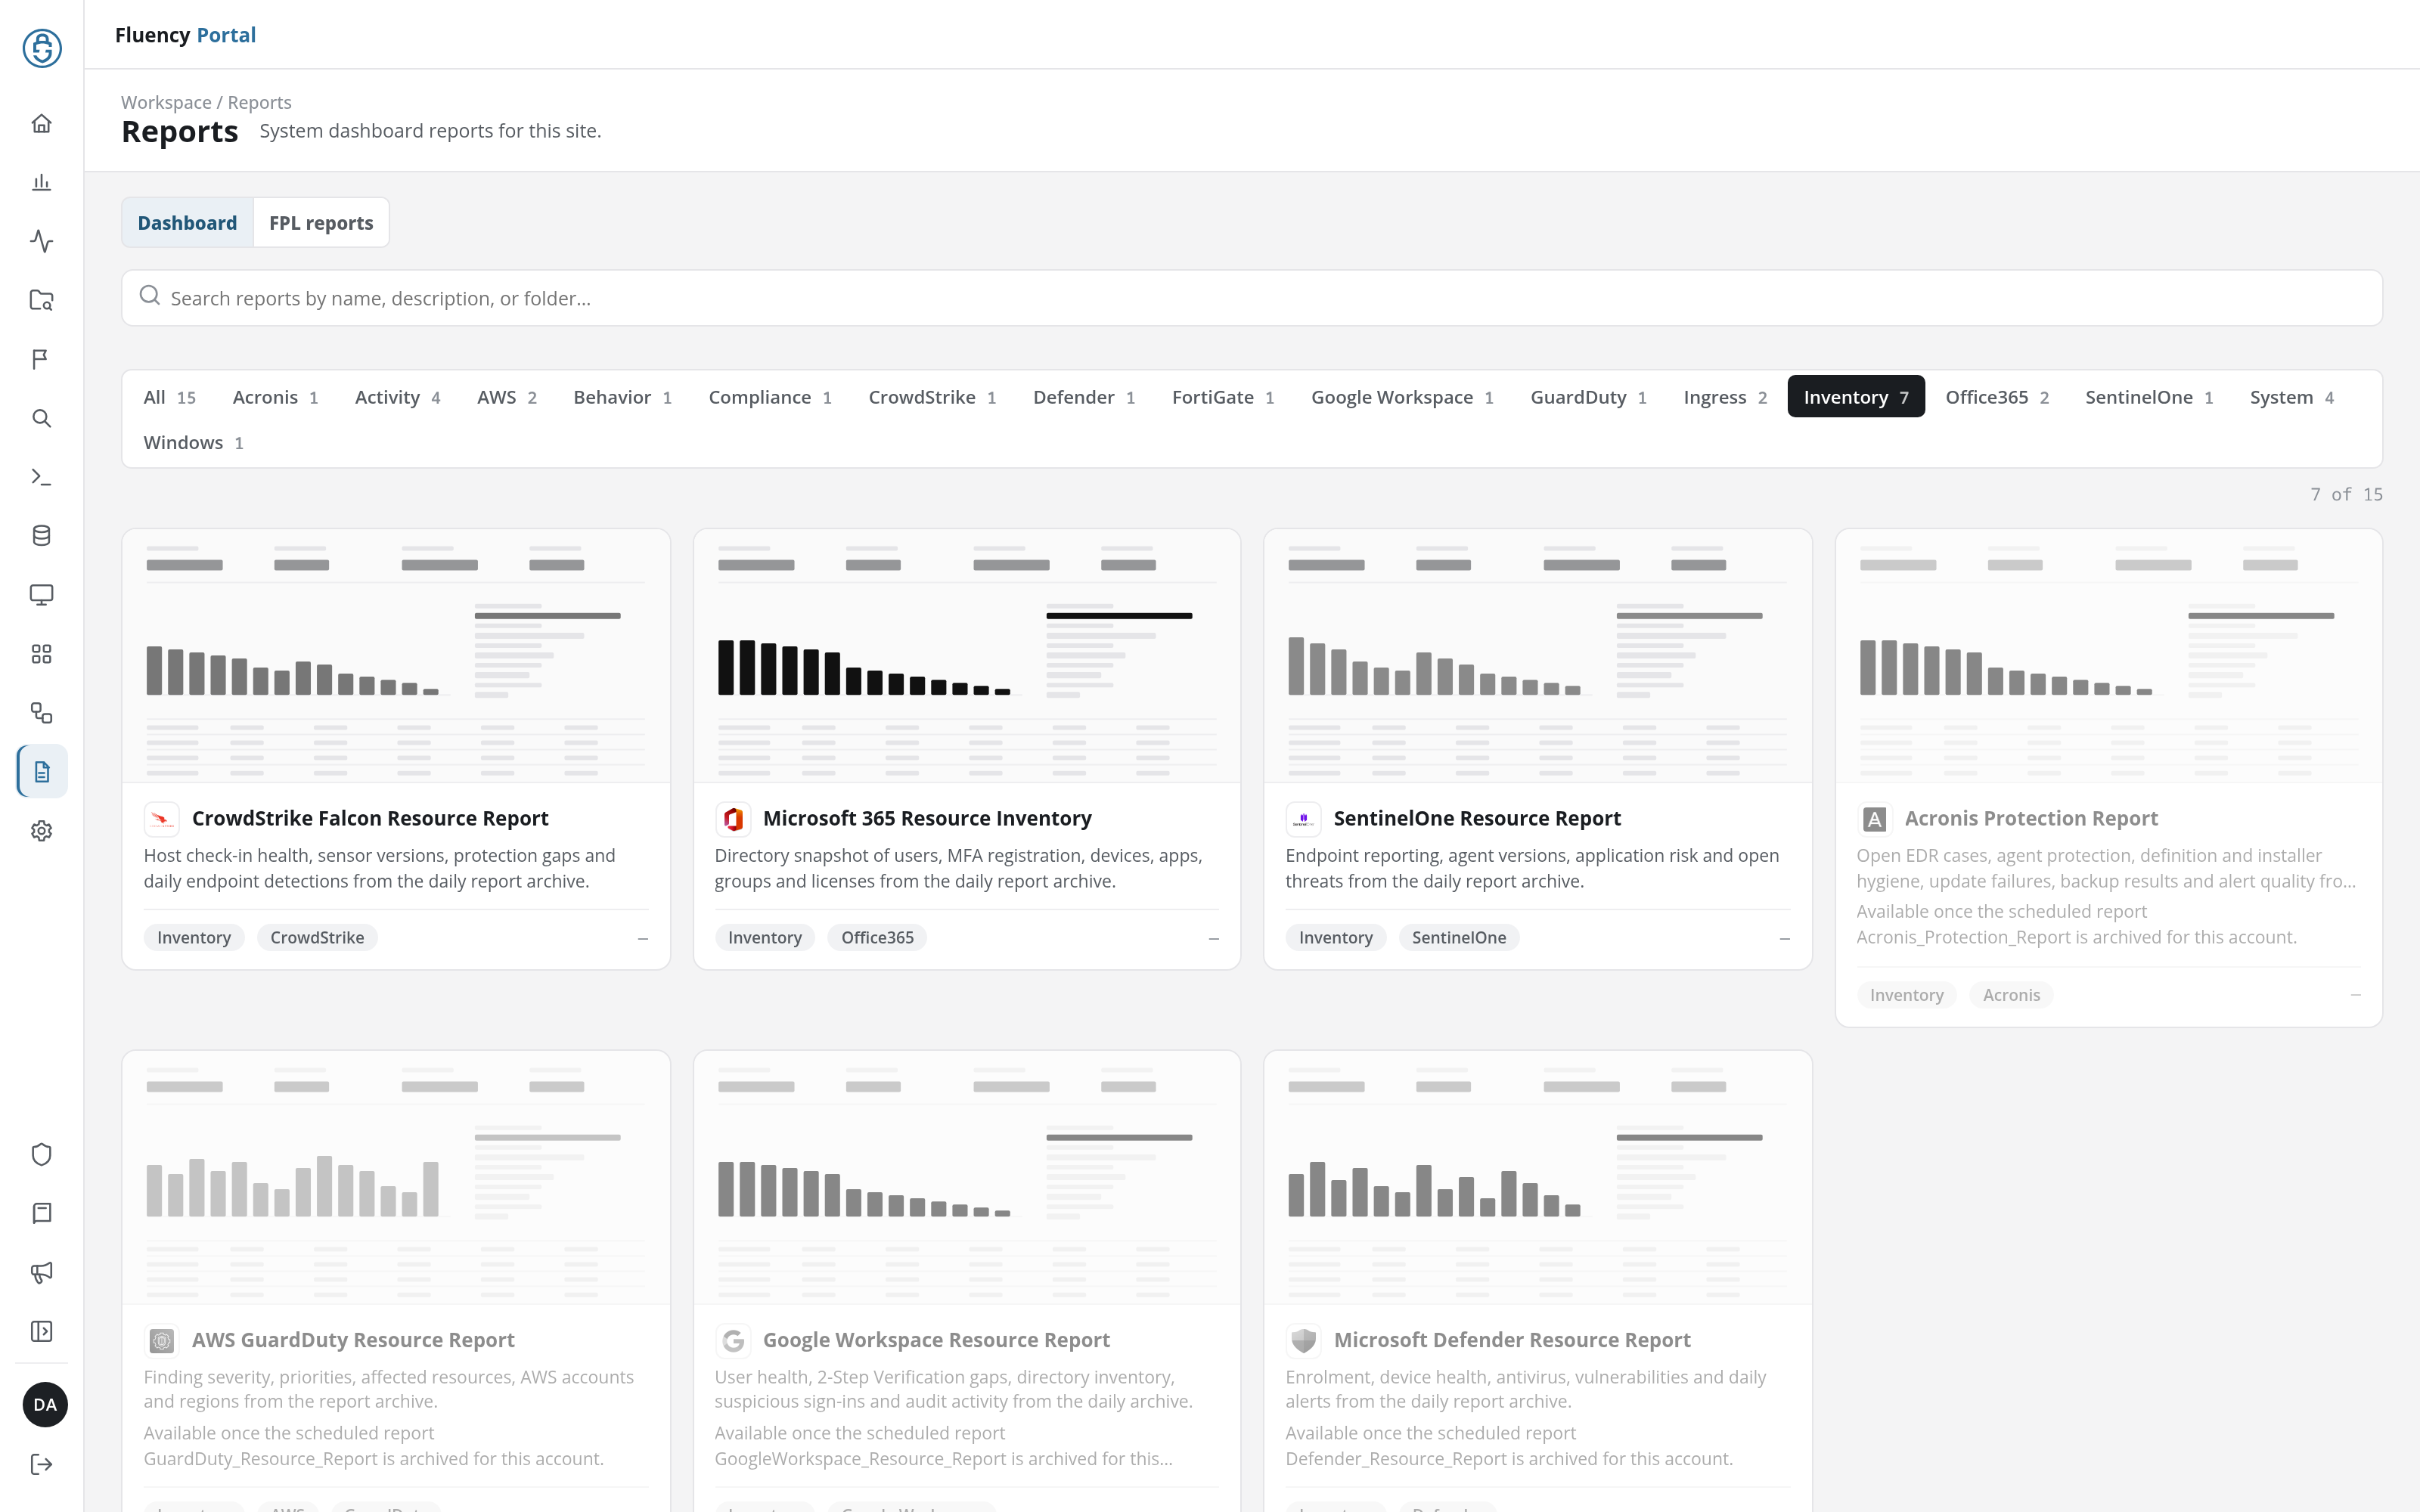
The Dashboard tab (System dashboard reports for this site.) shows one card per report. Each card has a preview of the report's layout, the product's icon (the Fluency mark on a system report), the report's name and description, and its tags: its kind (Activity, Behavior, Compliance, Ingress, or Inventory) and its product, or System.
- Filter buttons: All and one button per tag, each with its count of reports: Acronis, Activity, AWS, Behavior, Compliance, CrowdStrike, Defender, FortiGate, Google Workspace, GuardDuty, Ingress, Inventory, Office365, SentinelOne, System, and Windows. A button narrows the cards to the reports with that tag; the count on the right of the bar follows (for example 7 of 15 for Inventory).
- Search field: narrows the cards by name, description, or folder.
- Unavailable dashboards: a dashboard drawn from a report archive needs that archive to hold days for the account. Until it does, its card is greyed out, listed after the others, and reads Available once the scheduled report <report> is archived for this account. (for example
Acronis_Protection_Report); it does not open. The scheduled report and its daily archive are set up on Report Scheduler.
| Report | Tags | What it covers | Archive |
|---|---|---|---|
| Compliance Evidence Report | Compliance, System | NIST SP 800-53 control groups with the evidence the account currently observes. | - |
| CrowdStrike Falcon Resource Report | Inventory, CrowdStrike | Host check-in health, sensor versions, protection gaps and daily endpoint detections. | CrowdStrike_Resource_Report |
| Event Ingress Report | Ingress, System | Datalake event counts and ingress volume by index. | - |
| Microsoft 365 and Entra Activity Report | Activity, Office365 | Office 365 audit events, Entra sign-ins and directory changes. | Office365_Entra_Activity_Report |
| Microsoft 365 Resource Inventory | Inventory, Office365 | A directory snapshot of users, MFA registration, devices, apps, groups and licenses. | Office365_Resource_Inventory_Report |
| SentinelOne Resource Report | Inventory, SentinelOne | Endpoint reporting, agent versions, application risk and open threats. | SentinelOne_Resource_Report |
| Ticket Analysis Report | Behavior, System | High-score tickets by entity, rule, MTTR, and open status for a selected time range. | - |
| Usage Report | Ingress, System | Datalake ingest, search, and realtime usage for a selected time range. | - |
| Acronis Protection Report | Inventory, Acronis | Open EDR cases, agent protection, definition and installer hygiene, update failures, backup results and alert quality. | Acronis_Protection_Report |
| AWS CloudTrail Activity Report | Activity, AWS | AWS events, errors, console logins, IAM and root activity. | CloudTrail_Activity_Report |
| AWS GuardDuty Resource Report | Inventory, AWS, GuardDuty | Finding severity, priorities, affected resources, AWS accounts and regions. | GuardDuty_Resource_Report |
| FortiGate Security Activity Report | Activity, FortiGate | SSL-VPN failed logins and sessions, IPsec tunnels, blocks, IPS anomalies and admin changes. | Fortigate_Security_Activity_Report |
| Google Workspace Resource Report | Inventory, Google Workspace | User health, 2-Step Verification gaps, directory inventory, suspicious sign-ins and audit activity. | GoogleWorkspace_Resource_Report |
| Microsoft Defender Resource Report | Inventory, Defender | Enrolment, device health, antivirus, vulnerabilities and daily alerts. | Defender_Resource_Report |
| Windows Server Activity Report | Activity, Windows | Windows event ingestion, logons, account changes and audit-log tampering. | WindowsSrv_Activity_Report |
Archive names the scheduled report a dashboard is drawn from. The reports without a link have no archived days on the site shown, so their cards are greyed out.
Click a card to open its report. Every report page has a Back to Reports link above its title and a Download report button in the upper right. Download report saves the report as it is shown, as a self-contained HTML page named after the report and the day it is saved (for example event-ingress-report-<YYYY-MM-DD>.html): its title, the range (in UTC), the time it was generated, and the figures, charts, and tables.
Archive-backed Dashboards
A dashboard drawn from a report archive reads the daily results of its scheduled report (see Archived Reports) and searches nothing live. They share these controls:
- Time range: 1D (the default: the previous day, in UTC), 7D, 30D, and 90D, each ending on the previous day, then two date fields for the first and last day (UTC), joined by to, and a refresh button (such as Refresh archive report or Refresh inventory report). The URL carries the range (
from=<YYYY-MM-DD>&to=<YYYY-MM-DD>) and the open tab (tab=orsource=). - Read this first: on most of them, a note on how to read the figures, for example that an inventory's figures are the latest archived day, never a sum of days, and that a missing scan is not zero.
- Coverage: a band giving how many days of the range are archived, such as 1 of 1 days archived. Every day in this range has a completed archive., or, on an inventory, State as of <day>. When days are missing, the band turns red and names them, for example 6 of 7 days archived. Missing days are not counted: 2026-11-02. Backfill them from Admin › Archived Reports (Office365_Entra_Activity_Report). (see Backfill).
- Footer: the archive the counts come from, such as Counts come from the daily archive of the scheduled report Office365_Entra_Activity_Report; nothing is searched live. An inventory adds that each archived day is the console at that run, and that a backfill records today's state under a past date.
A part of a dashboard whose data table the account does not have reads <part> is not available: followed by the reason, or, for a whole source, says so (This account has no Office365 table, so there is no Office 365 activity to show. This is not a zero.).
Event Ingress Report
URL path: /v2/reports?kind=dashboard&name=ingress&range=1d
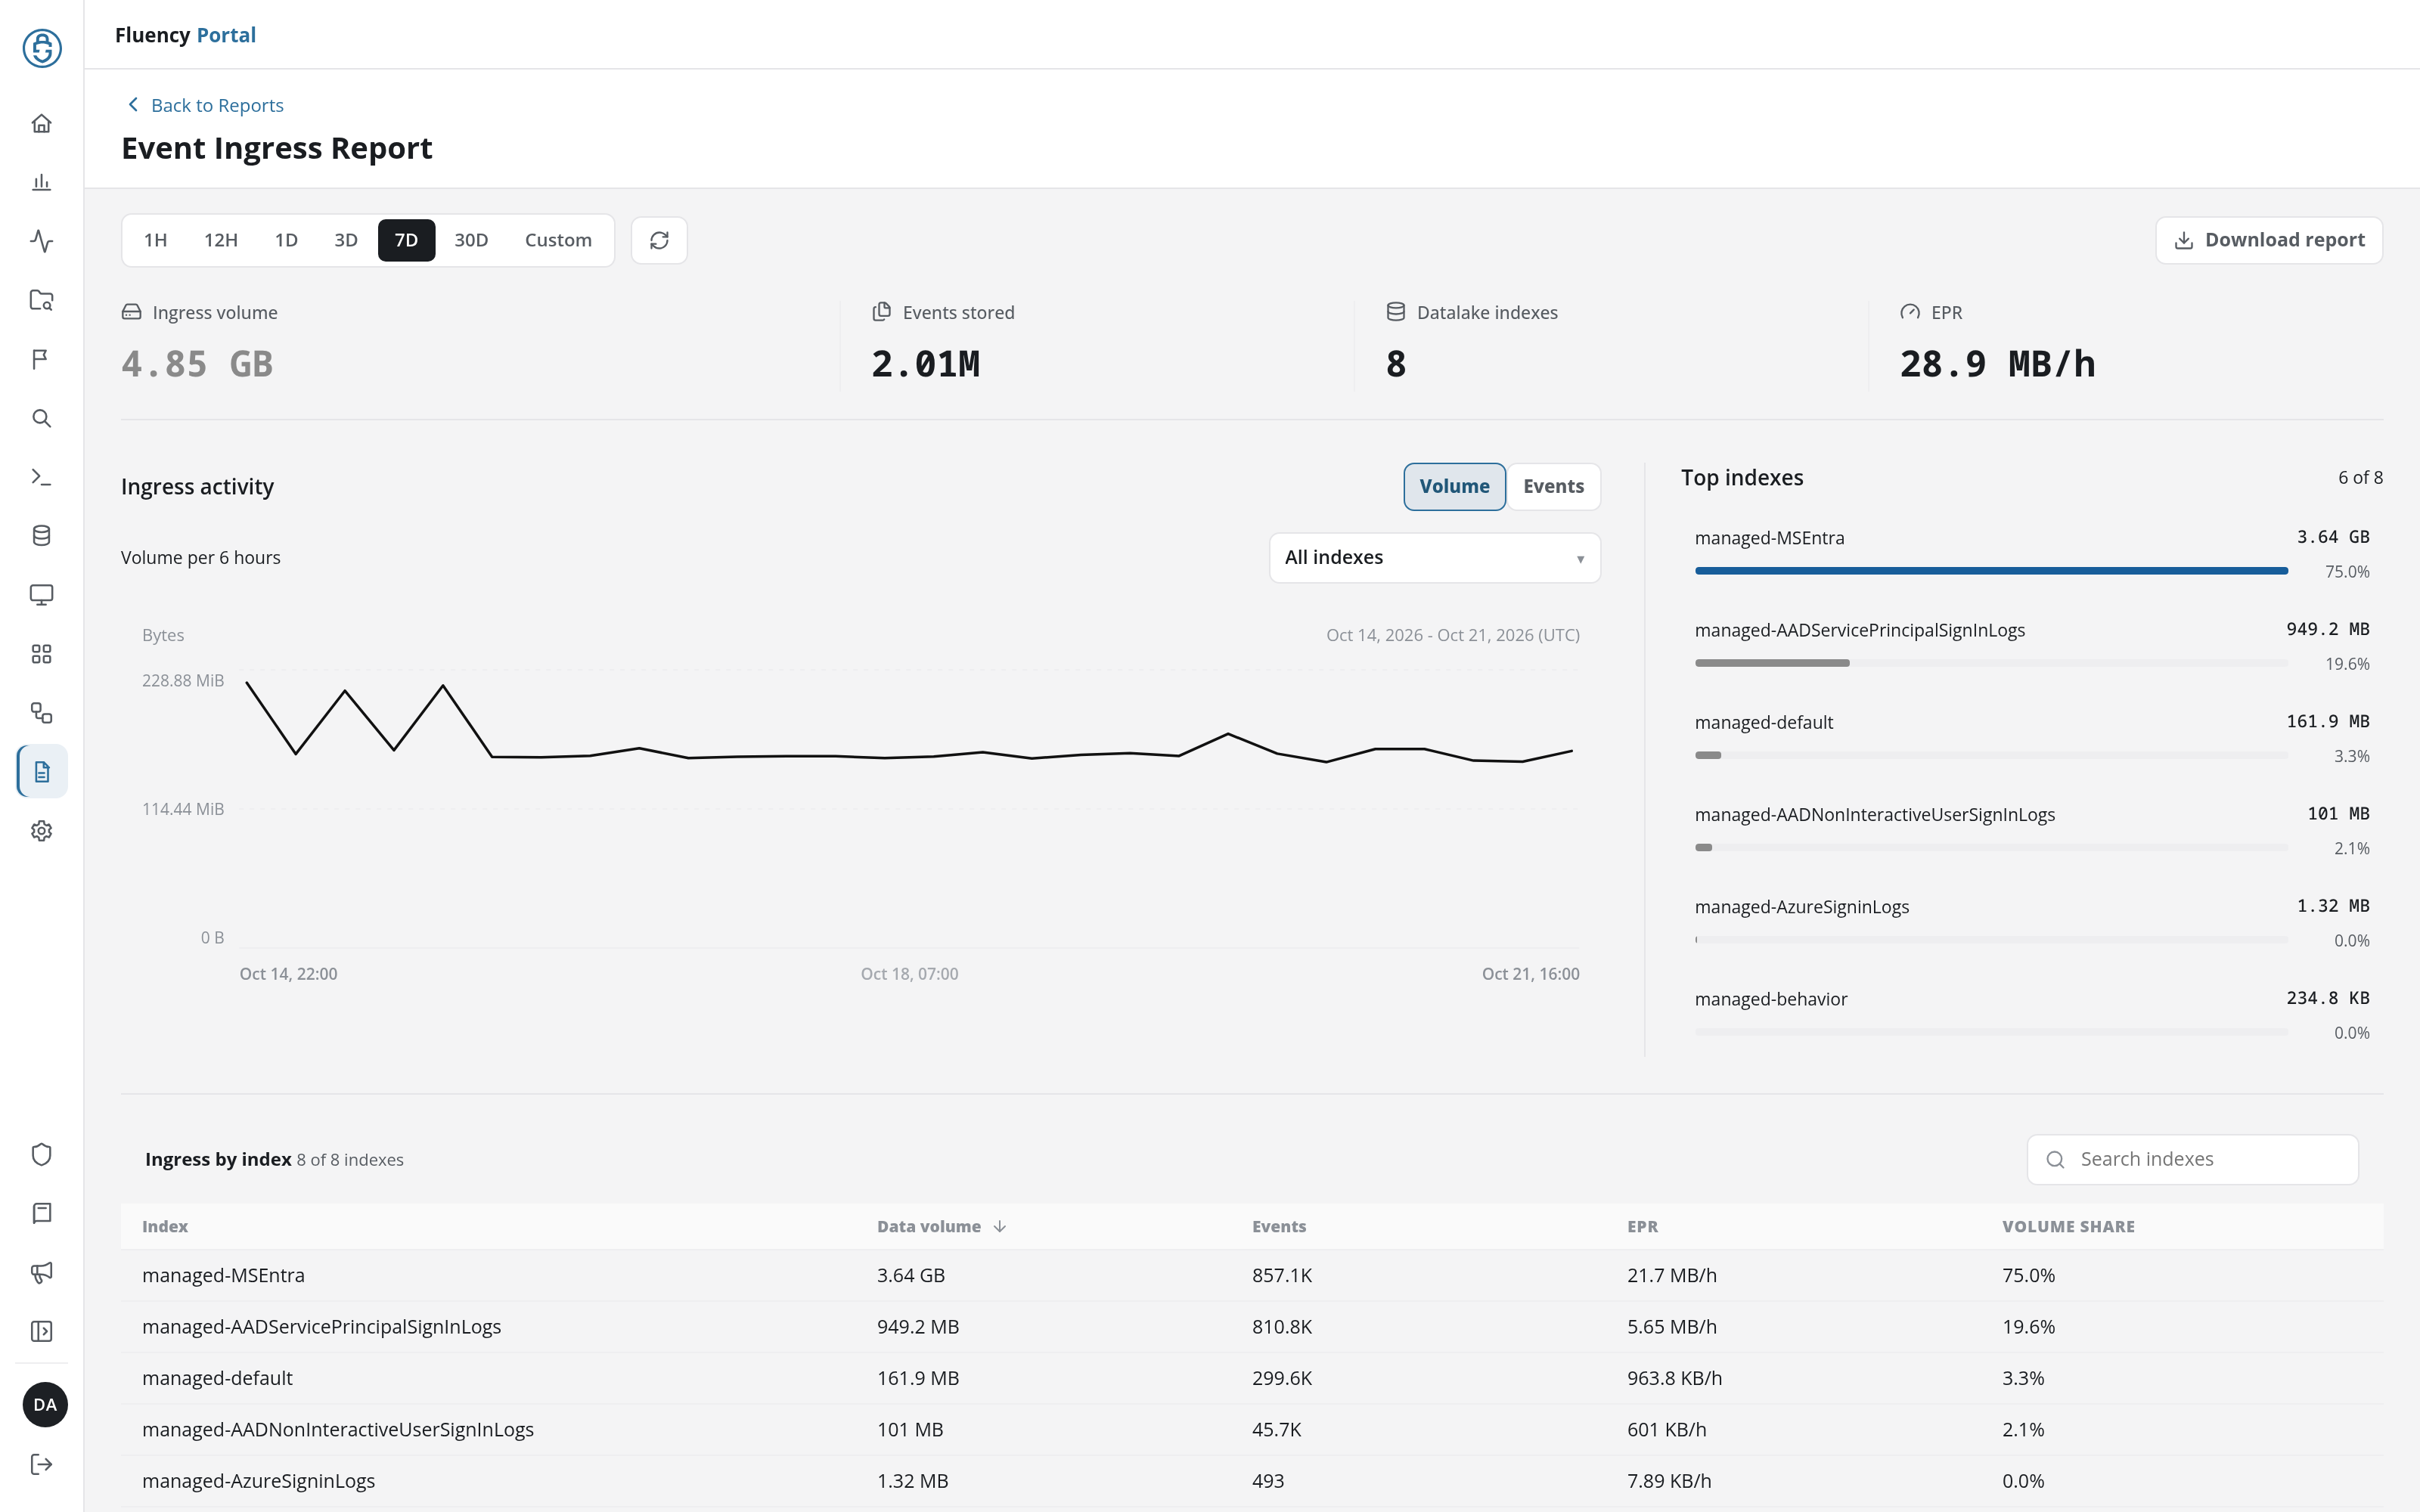
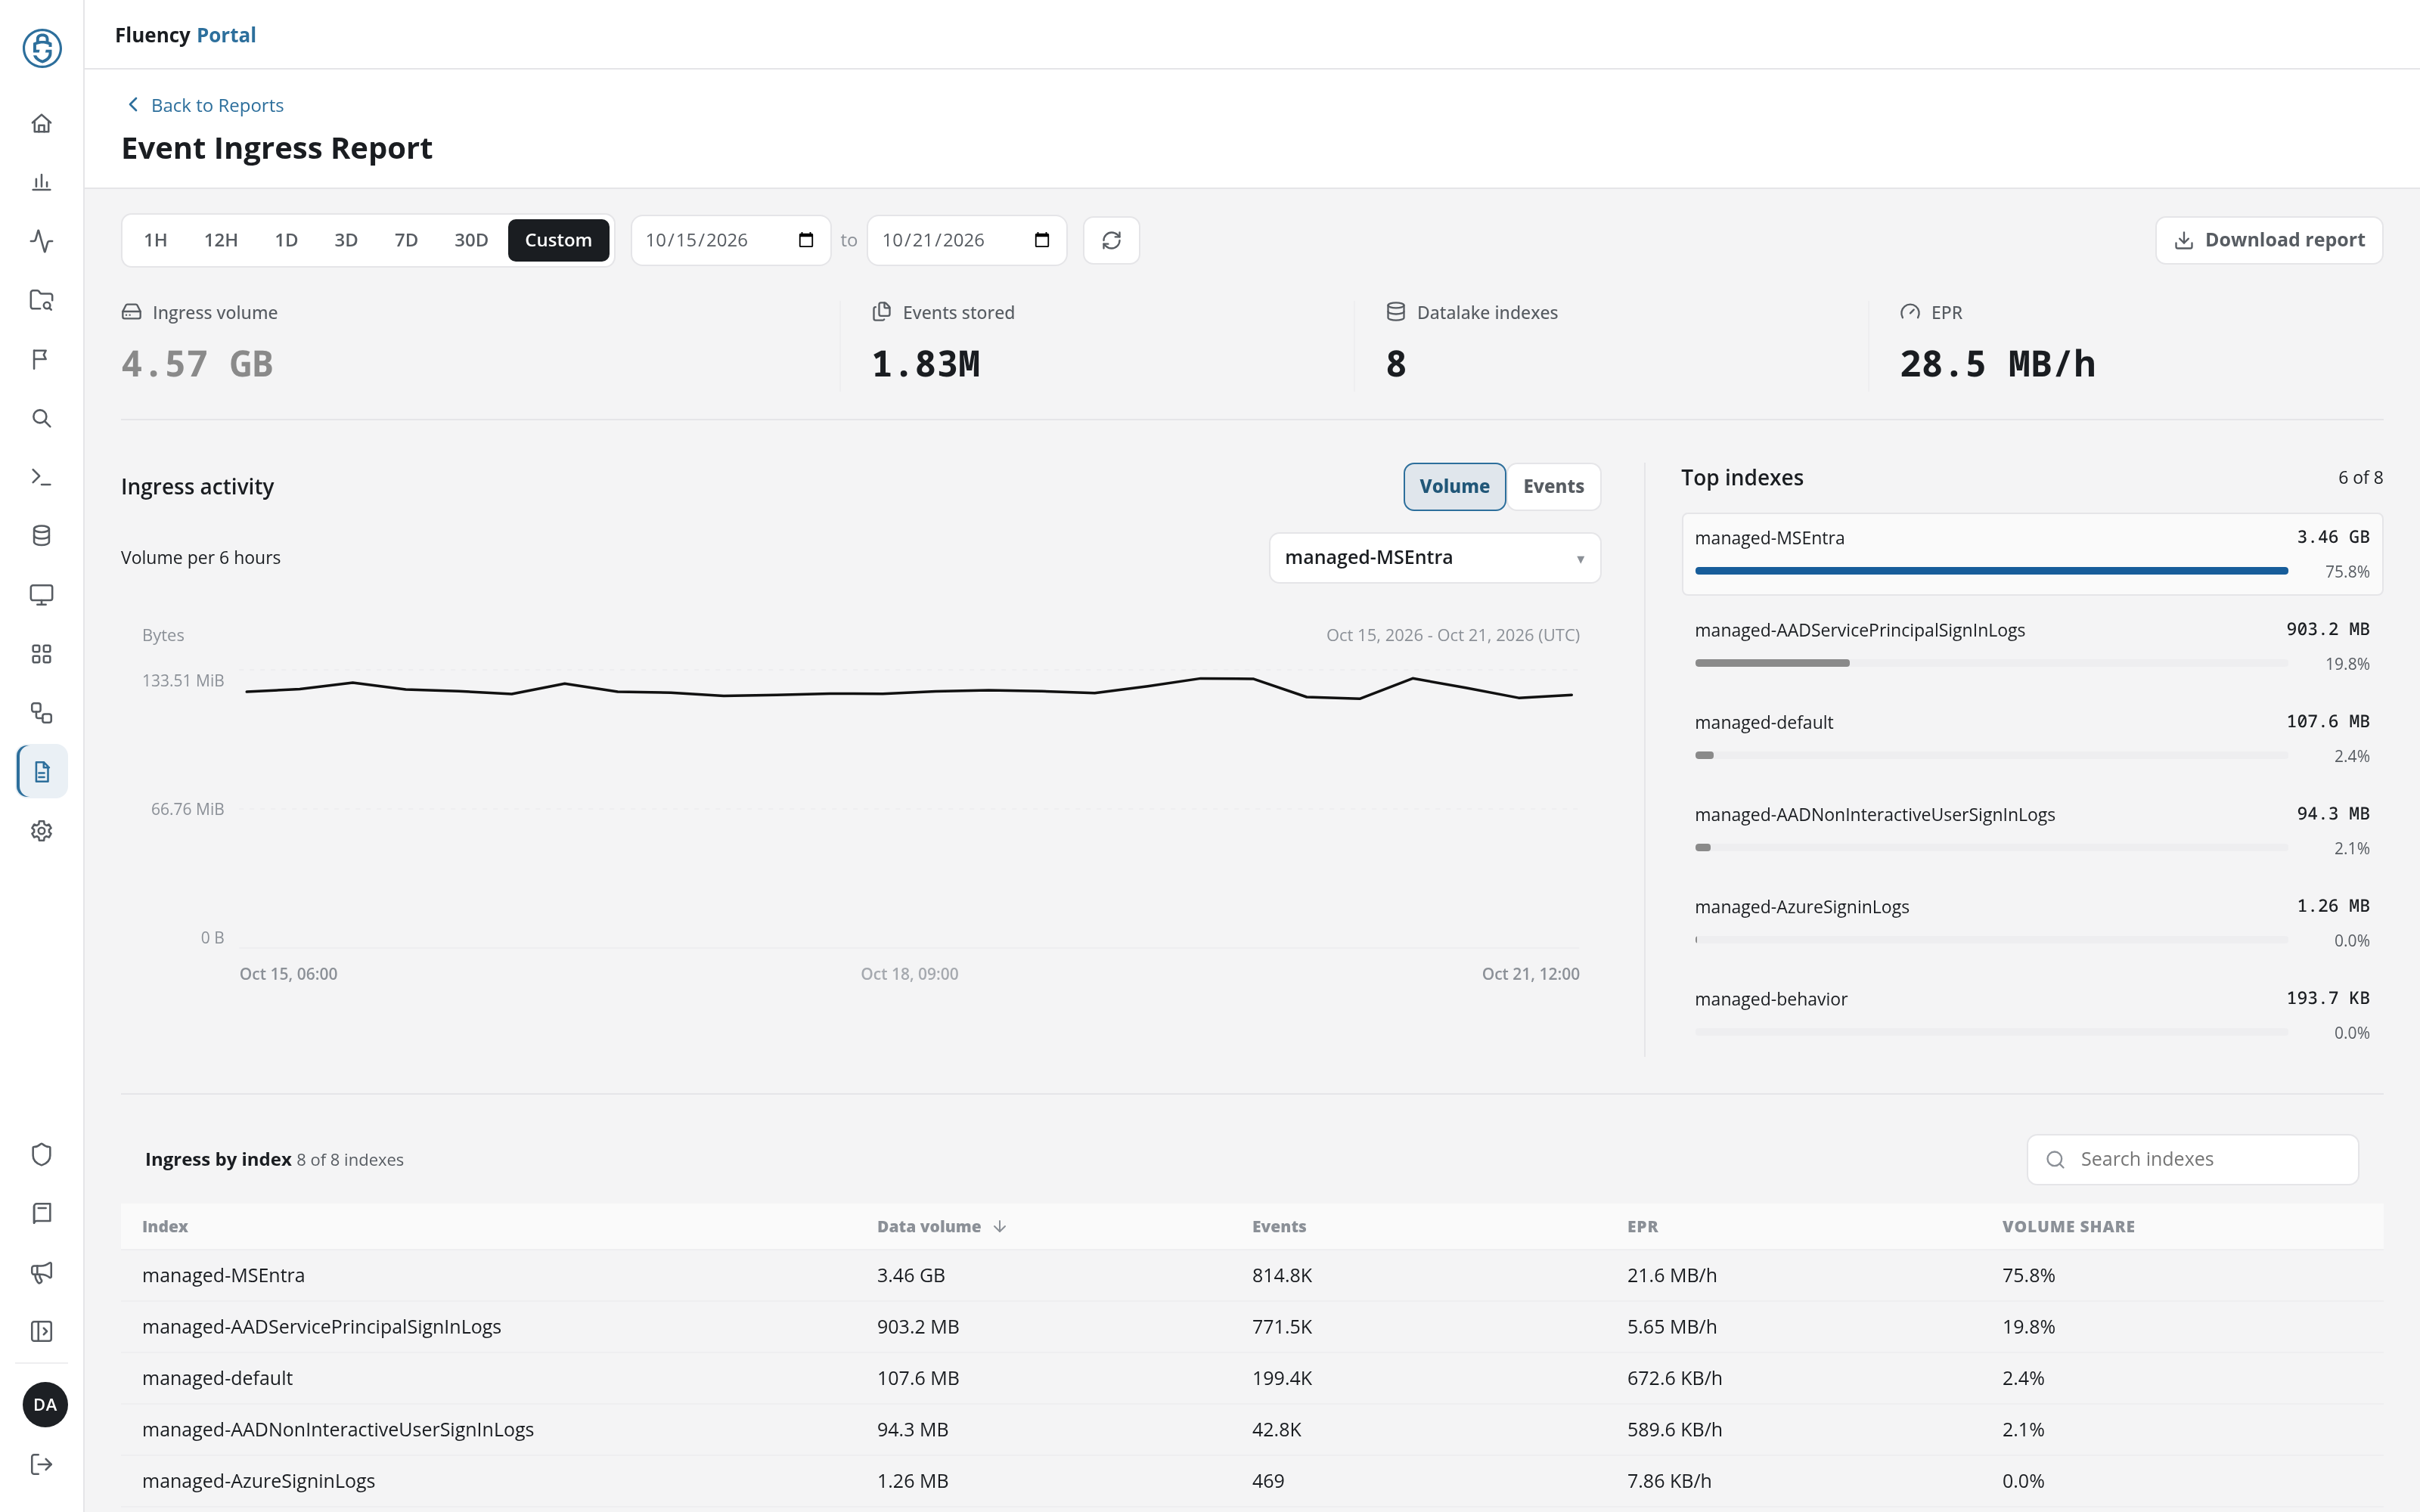
- Time range: 1H, 12H, 1D (the default), 3D, 7D, 30D, and Custom. The range is part of the URL (
range=1h,range=12h, …). Custom adds two date fields, Start date (UTC) and End date (UTC), joined by to, for the first and last day, written to the URL asrange=custom&from=<YYYY-MM-DD>&to=<YYYY-MM-DD>; changing a date reloads the report at once. The circular-arrow button beside the range (Refresh ingress report) reloads the report. - Headline figures: Ingress volume, Events stored, Datalake indexes (the number of indexes in the report), and EPR, the ingress rate per hour.
- Ingress activity: a line chart of ingress over the range, bucketed as the label above it says (for example Volume per 6 hours), with the range's dates in UTC. Volume and Events switch what it plots, and the index drop-down (All indexes by default) limits it to one index.
- Top indexes: the busiest indexes (for example 6 of 8), each with its volume, a bar, and its share of the total. Click an index to chart it alone: the chart's drop-down switches to that index and the entry is outlined.
- Ingress by index: every index (8 of 8 indexes) with its Data volume, Events, EPR, and Volume share. The table is sorted by Data volume; the Index, Data volume, and Events headers re-sort it, and Search indexes narrows it.
Ticket Analysis Report
URL path: /v2/reports?kind=dashboard&name=tickets&range=1d
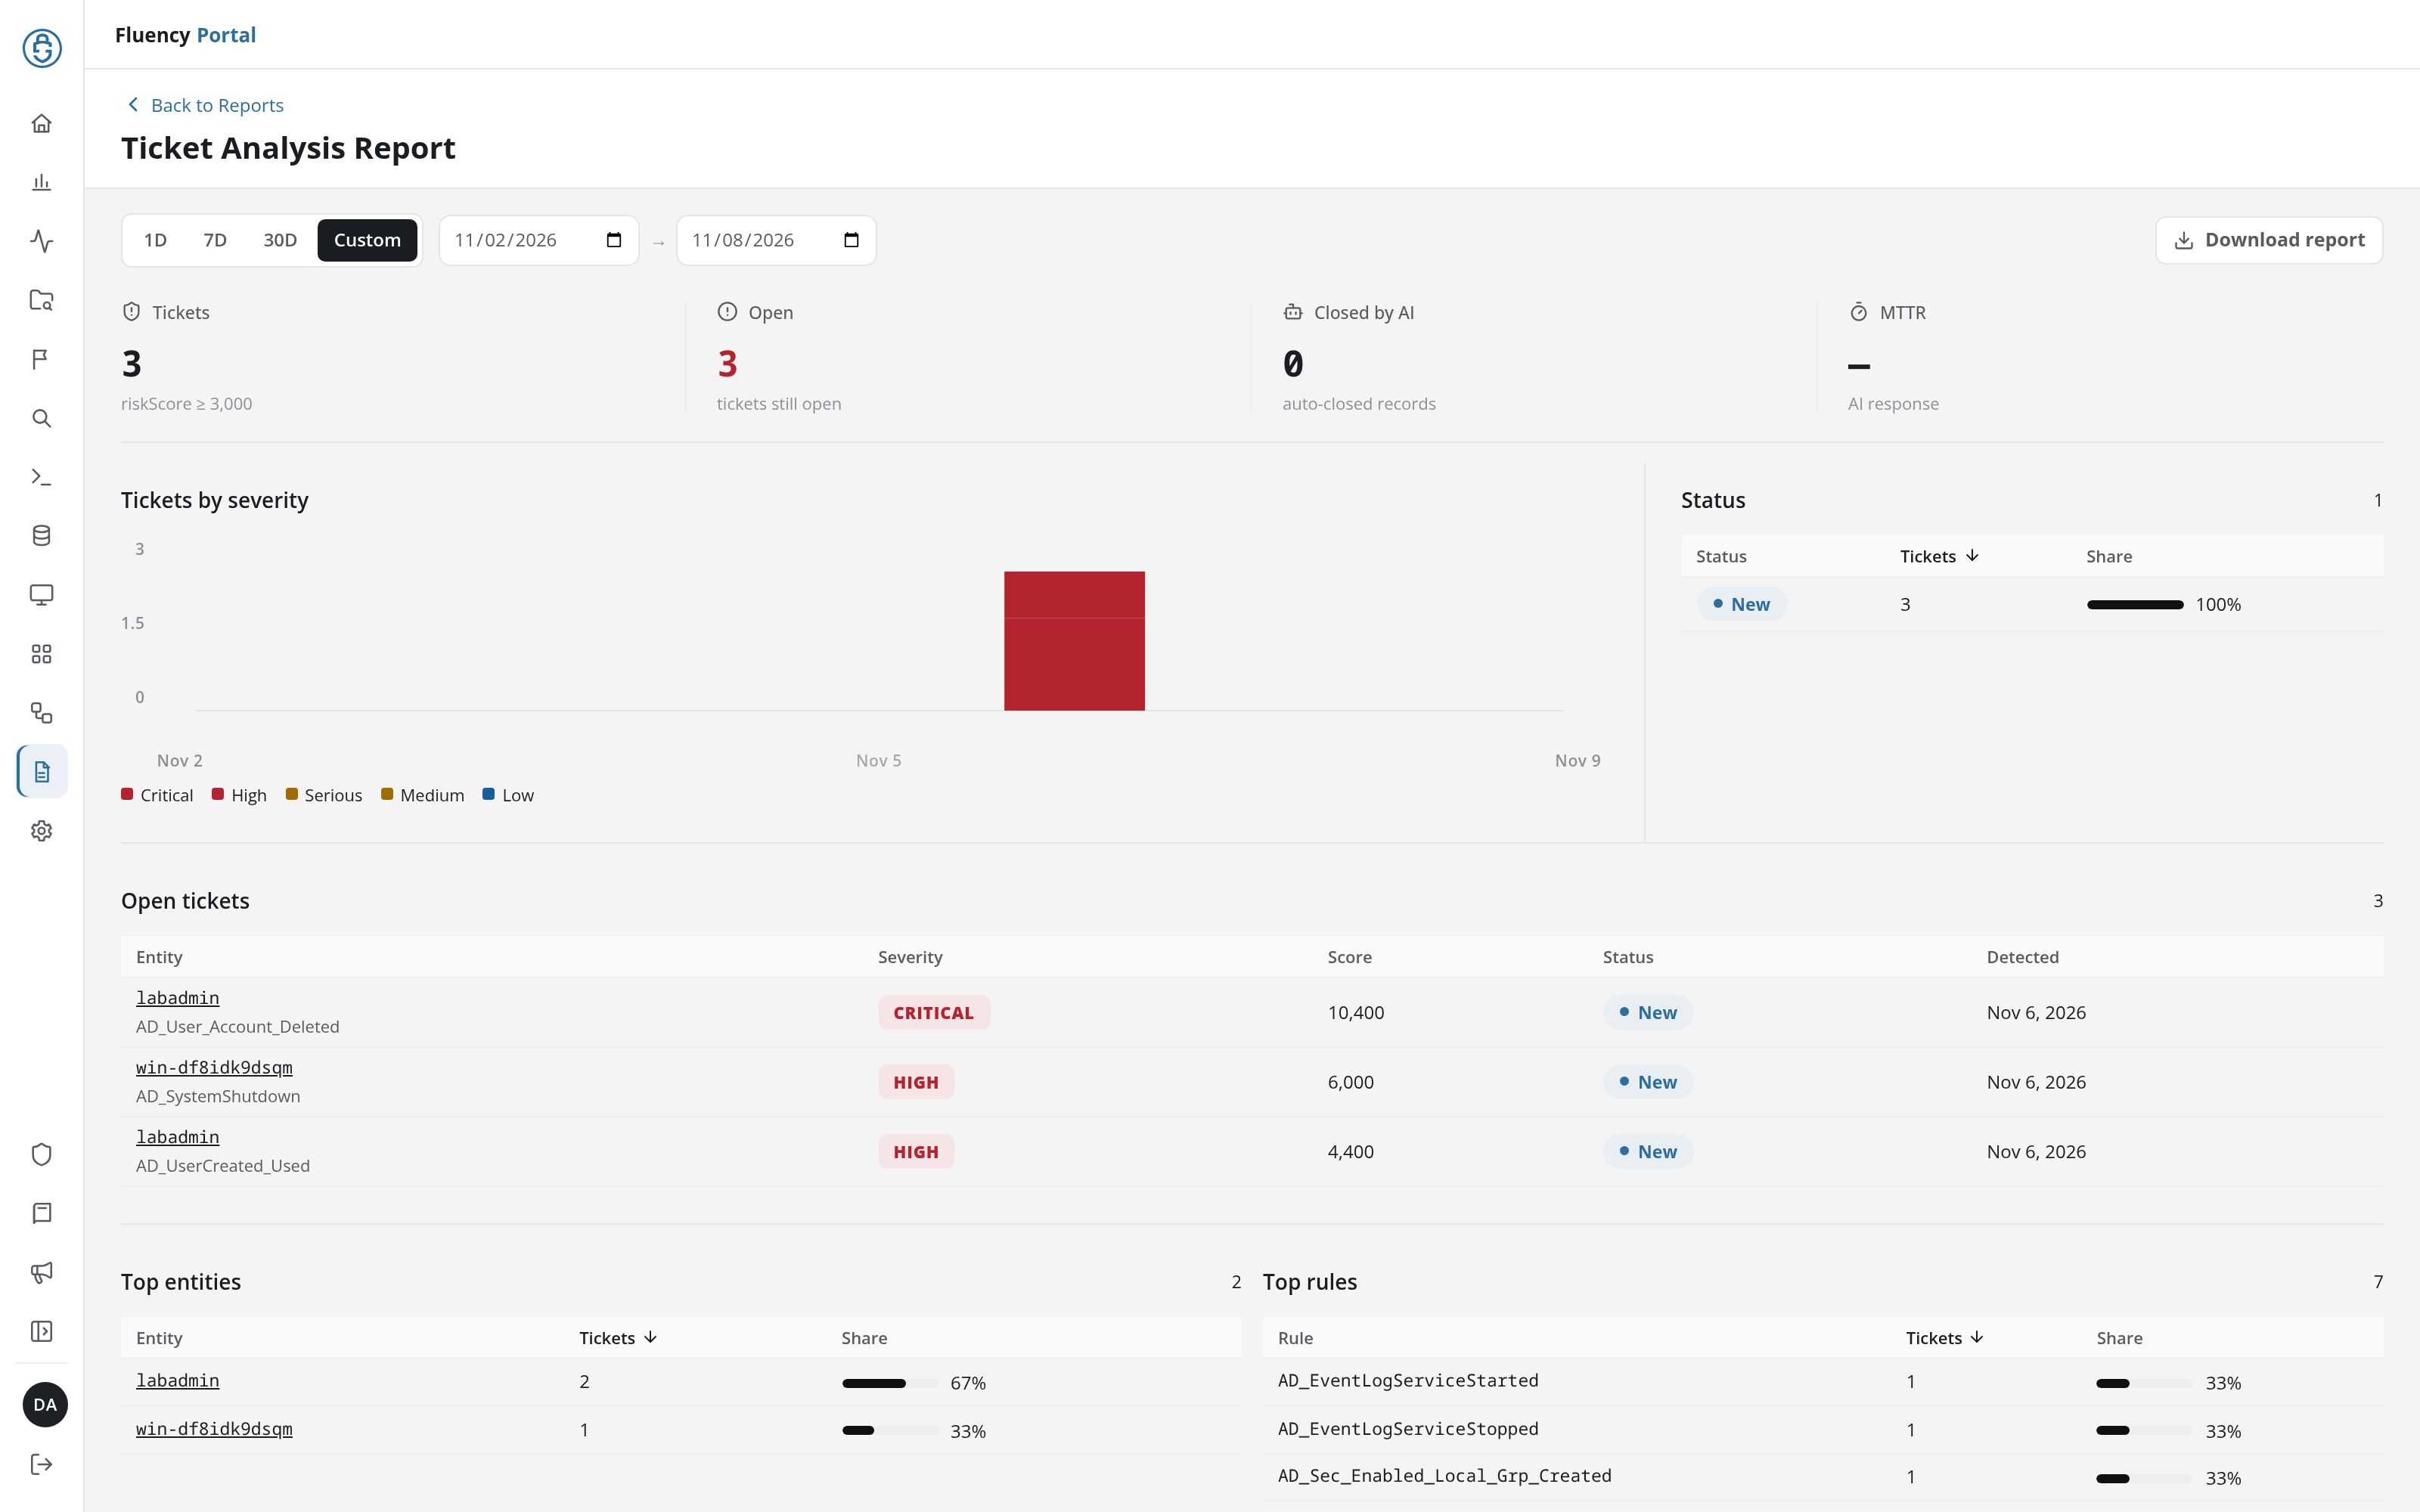
- Time range: 1D (the default), 7D, 30D, and Custom. The range is part of the URL (
range=1d,range=7d,range=30d); Custom adds Start date (UTC) and End date (UTC) fields and is written asrange=custom&from=<date>&to=<date>. - Headline figures: Tickets (tickets with a
riskScoreof at least 3,000), Open (tickets still open), Closed by AI (auto-closed records), and MTTR (the time to an AI response). - Panels: Tickets by severity, a bar chart of the range's tickets coloured by severity; Status, Top entities, and Top rules, tables of the tickets per status, entity, and rule, each with its Share of the total (click a column header to re-sort the table); and Classification. A panel with nothing in the range says so, for example No high-score tickets in this time range.
- Open tickets: when the range holds open tickets, a panel between Status and Top entities lists them, with the columns Entity (the entity, with the rule that raised the ticket beneath it), Severity (a badge such as CRITICAL), Score, Status (such as New), and Detected (the date). Each entity is a link to its Behavior Summary page for the ticket's day (
/v2/behavior-summary?id=%22<entity>%22&dayIndex=<YYYYMMDD>). The entities in Top entities link to Behavior Summary too, by entity alone (/v2/behavior-summary?id=%22<entity>%22).
Usage Report
URL path: /v2/reports?kind=dashboard&name=usage&from=<date>&to=<date>
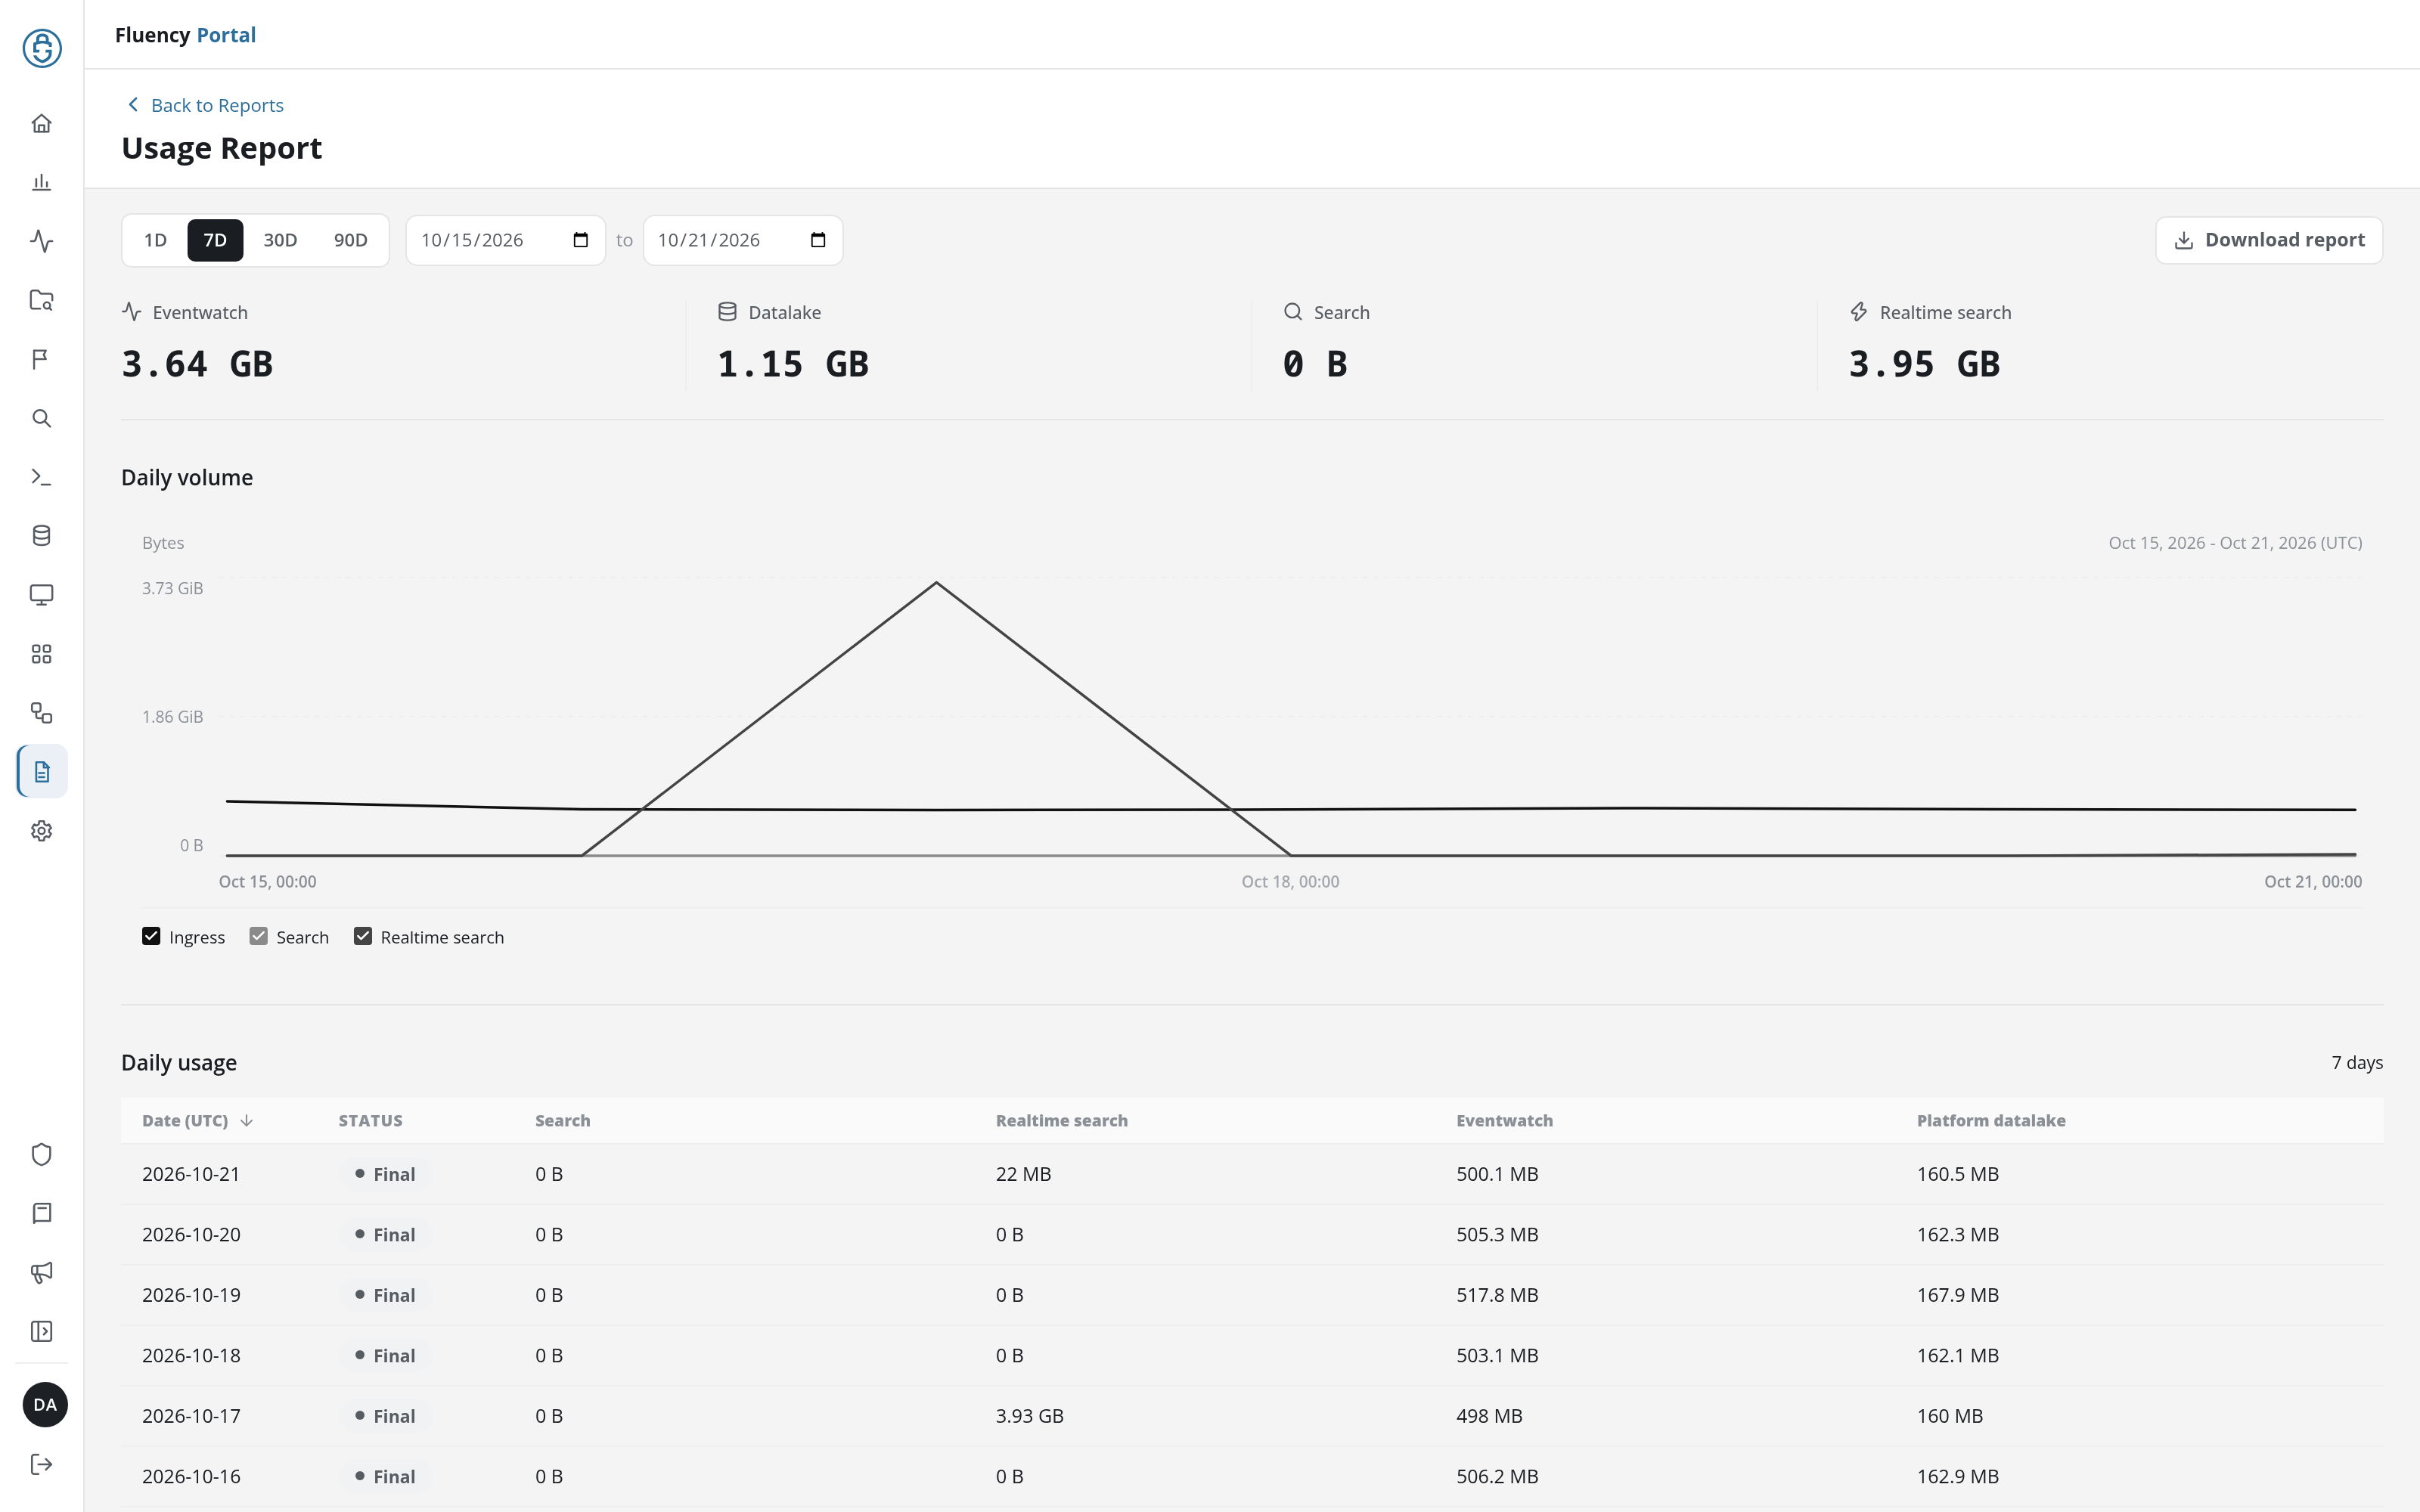
- Time range: 1D (the default: today, in UTC), 7D, 30D, and 90D, each ending today, followed by two date fields, Start date (UTC) and End date (UTC), showing the range's first and last day. The URL carries the two dates (
from=2026-10-15&to=2026-10-21); the range buttons rewrite them. - Headline figures: the range's total for Eventwatch, Datalake, Search, and Realtime search. When days in the range have no figures, a Missing data: line beneath each total counts them (for example 1 of 7 days).
- Daily volume: a line chart of each day's volume, in UTC. The checkboxes beneath it (Ingress, Search, and Realtime search) show or hide each line.
- Daily usage: one row per day, newest first, with the columns Date (UTC), Status, Search, Realtime search, Eventwatch, and Platform datalake. Status is Final for a day whose figures are complete, Open for the current day, and Missing for a day without figures, whose values read Unavailable.
Compliance Evidence Report
URL path: /v2/reports?kind=dashboard&name=compliance&tab=controls
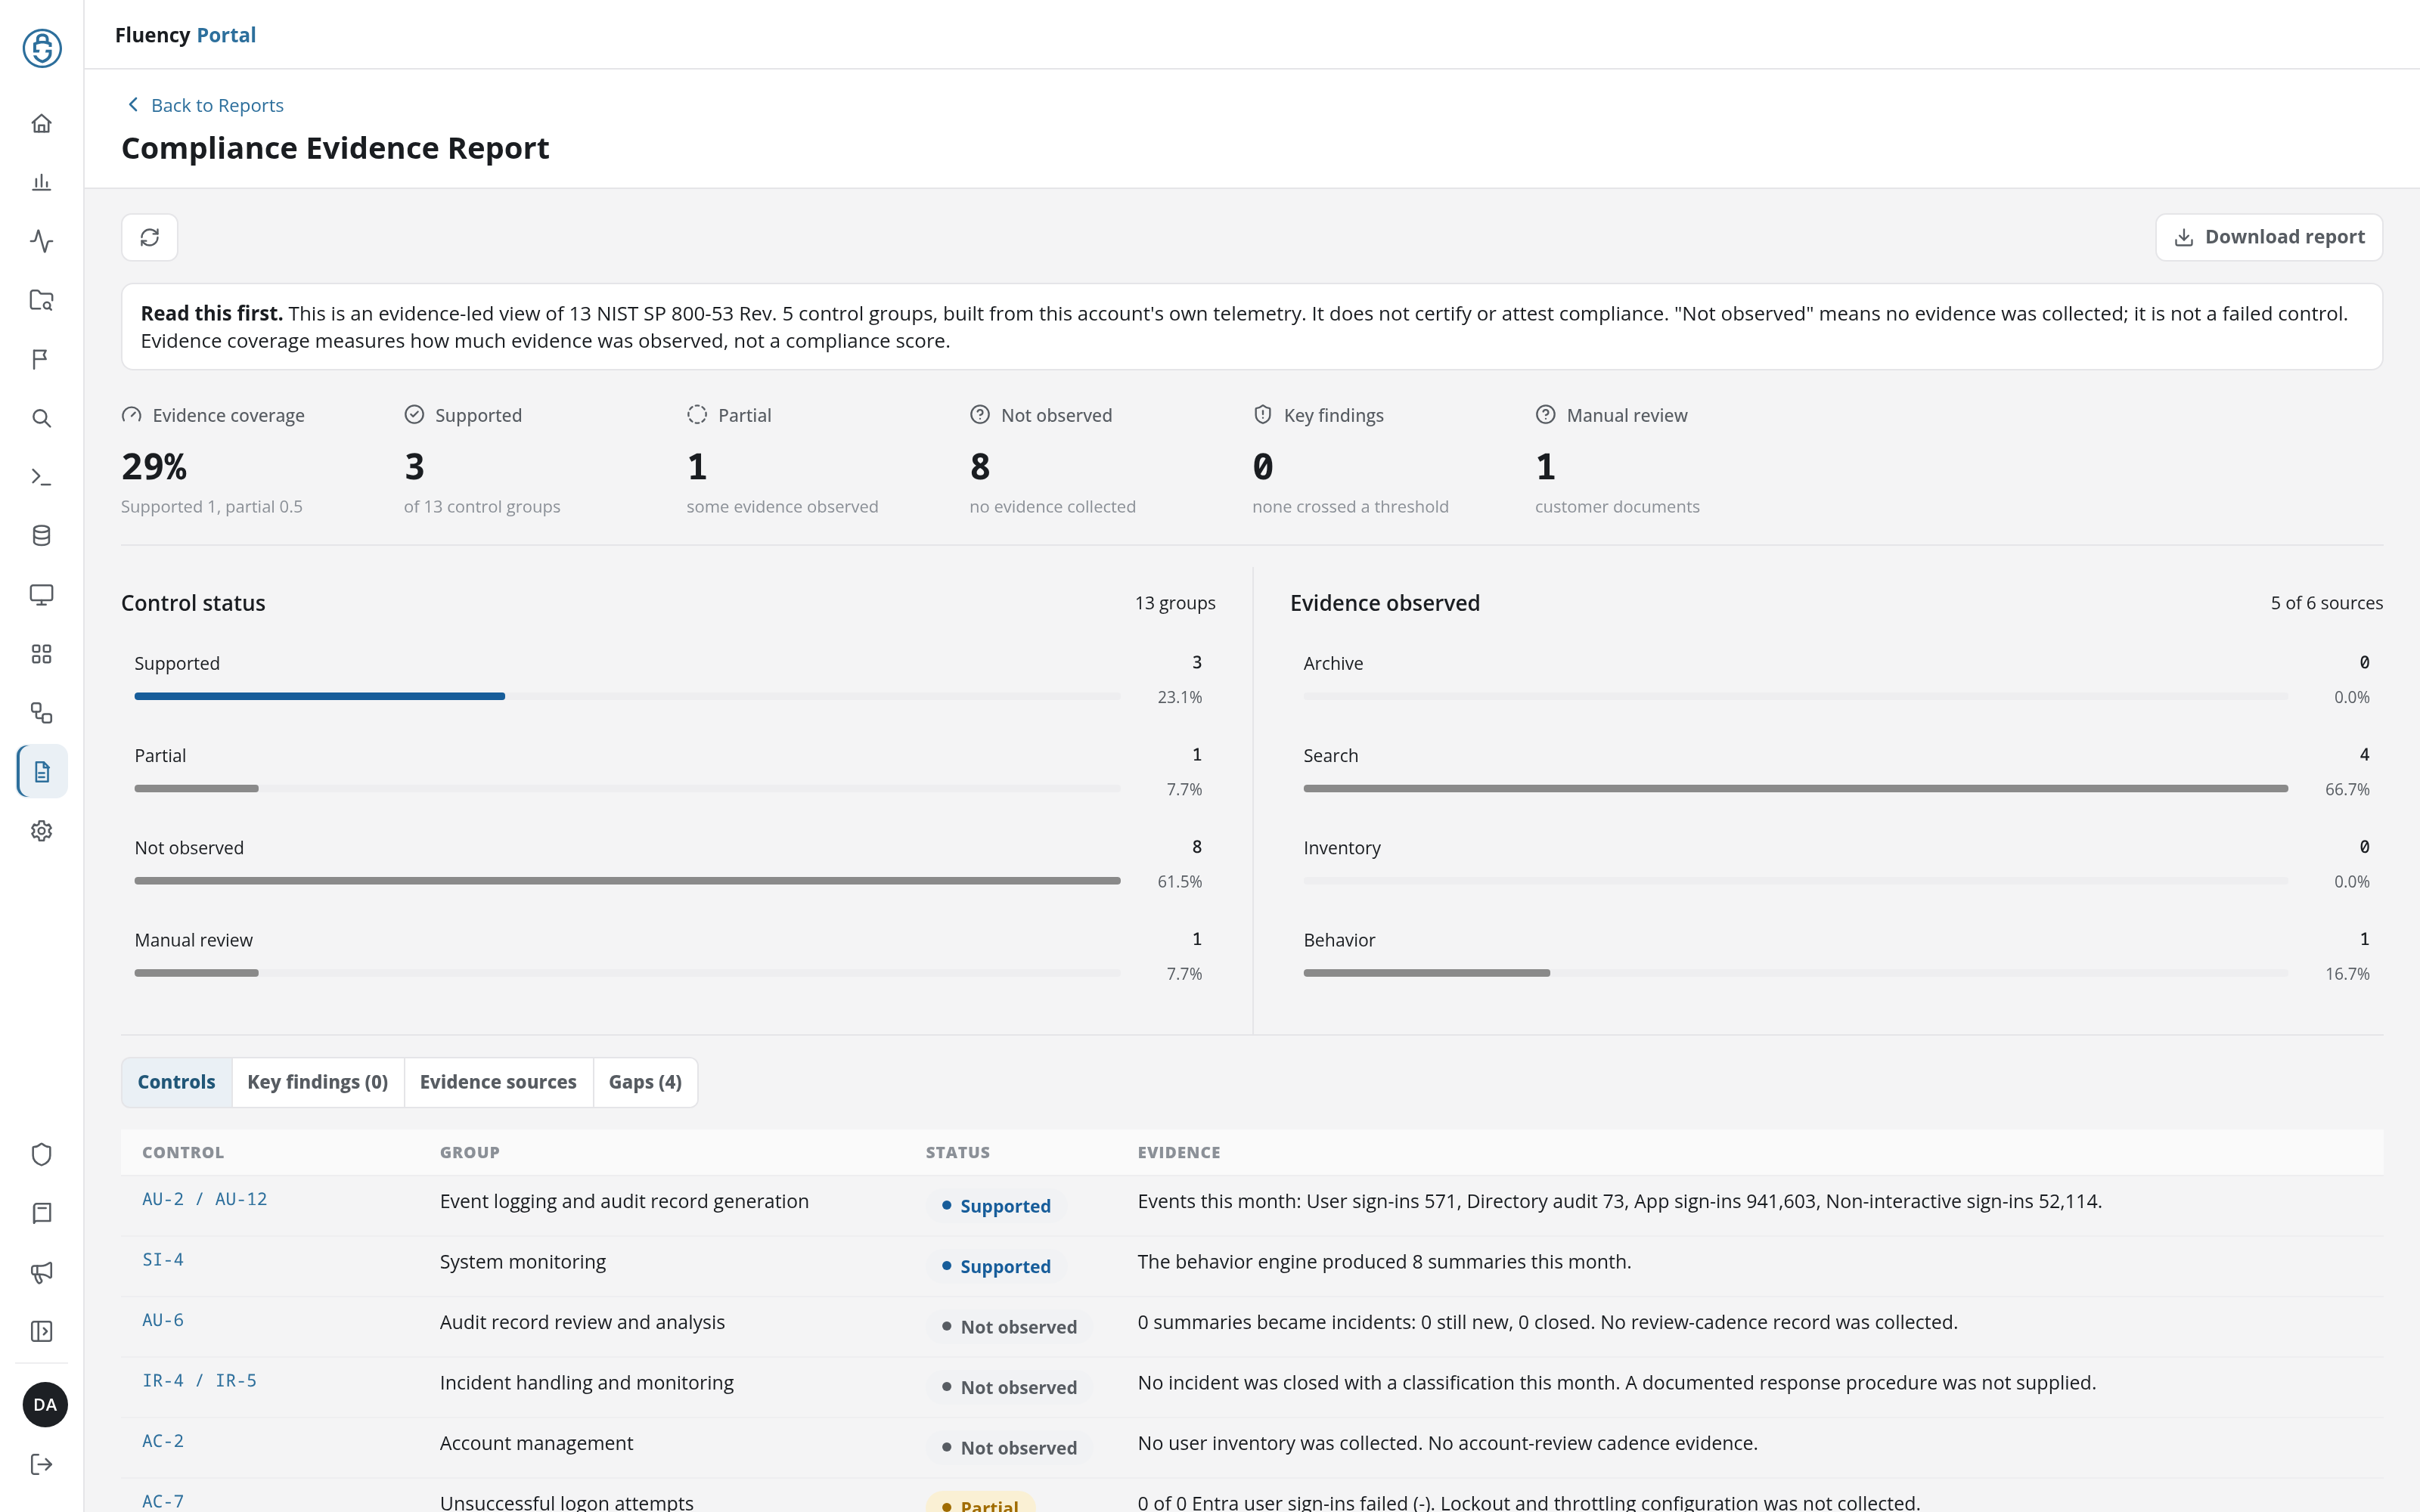
The report has no time-range buttons: it covers the current month up to the previous day (for example Event counts cover 2026-11-01 to 2026-11-08 (UTC).), with a refresh button (Refresh compliance report) and Download report.
- Read this first: This is an evidence-led view of 13 NIST SP 800-53 Rev. 5 control groups, built from this account's own telemetry. It does not certify or attest compliance. "Not observed" means no evidence was collected; it is not a failed control. Evidence coverage measures how much evidence was observed, not a compliance score.
- Headline figures: Evidence coverage (a percentage, counting a supported group as 1 and a partial one as 0.5), Supported (of 13 control groups), Partial (some evidence observed), Not observed (no evidence collected), Key findings (with how many are high), and Manual review (customer documents).
- Control status: a bar per status with its count and share of the 13 groups. Evidence observed: a bar per method the evidence came from (Archive, Search, Inventory, and Behavior), out of the sources observed (6 of 6 sources).
- Tabs (the open one is in the URL,
tab=):- Controls (
controls): one row per control group: Control (such as AU-2 / AU-12), Group (such as Event logging and audit record generation), Status (Supported, Partial, Not observed, or Manual review), and Evidence, the figures behind the status or what was not collected. AC-1 / IA-1 / IR-1, Policy and procedures, is always Manual review: Policy documents are customer-supplied evidence; telemetry cannot prove them. - Key findings (<n>) (
findings): Severity, Finding (with the controls it concerns), and Evidence and action, ending in a Recommended action:. - Evidence sources (
evidence): Source, Table, Method (Archive, Search, or Behavior), Count, Feeds (the controls it supports), State, and Note (such as 6 of 8 days archived.). - Gaps (<n>) (
gaps): what was not observed and why, such as No vulnerability scanner inventory, so vulnerability monitoring (RA-5) is not observed., and the sources with days missing from their archive.
- Controls (
- Footer: where each count comes from. Event and inventory counts come from their report archives when the current month has a completed archived day, and otherwise from one KQL query per source.
Microsoft 365 and Entra Activity Report
URL path: /v2/reports?kind=dashboard&name=entra-activity&from=<YYYY-MM-DD>&to=<YYYY-MM-DD>&source=o365
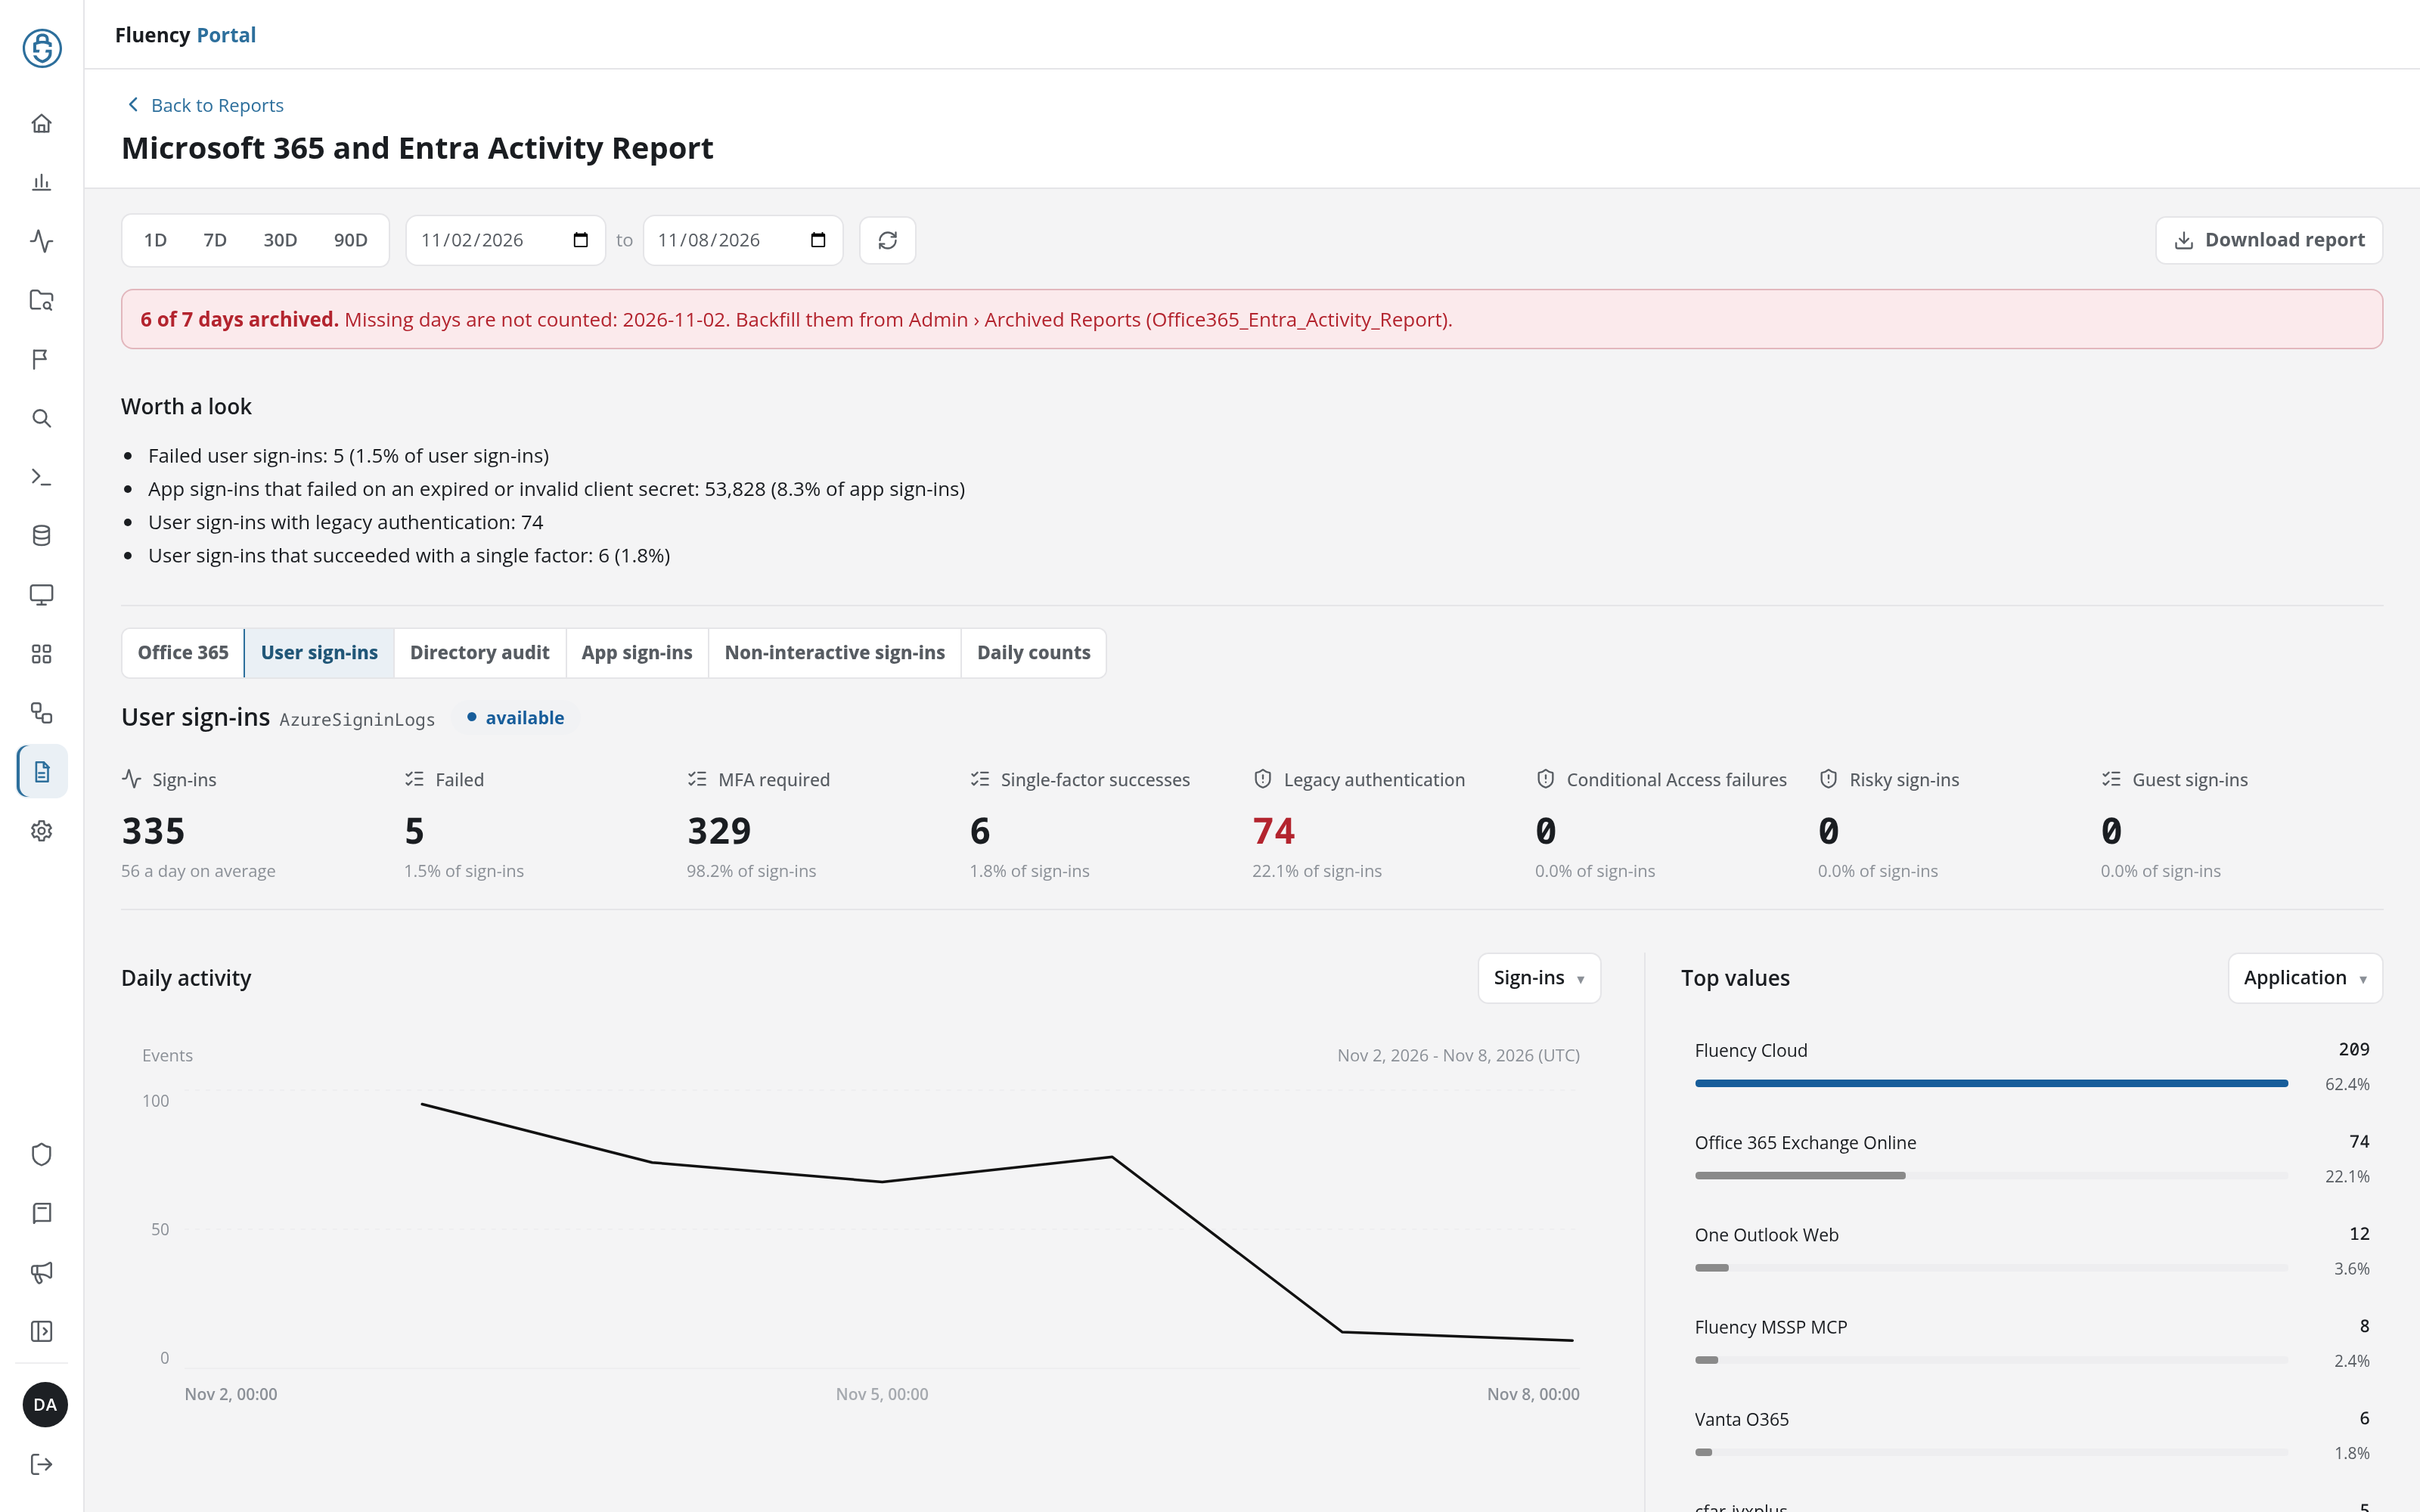
The archive-backed report of Office365_Entra_Activity_Report, with the refresh button Refresh archive report.
- Worth a look: a short list of figures that stand out in the range, such as Failed user sign-ins: 5 (1.5% of user sign-ins) or App sign-ins that failed on an expired or invalid client secret: 53,828 (8.3% of app sign-ins).
- Tabs (in the URL as
source=): Office 365 (o365), User sign-ins (signin), Directory audit (audit), App sign-ins (sp), Non-interactive sign-ins (ni), and Daily counts (daily). - A source tab is headed with the source and its table (such as User sign-ins
AzureSigninLogs) and available, then:- Figures: User sign-ins: Sign-ins (with the daily average), Failed, MFA required, Single-factor successes, Legacy authentication, Conditional Access failures, Risky sign-ins, and Guest sign-ins. Directory audit: Changes logged, Failed, User changes, Group changes, Role changes, Application changes, Policy changes, and Password events. App sign-ins: Sign-ins, Failed, Client secret errors, Client secret auth, and Certificate or federated auth. Non-interactive sign-ins: Sign-ins, Failed, and Guest sign-ins. Each figure but the first gives its share.
- Daily activity: a chart of the range, with a drop-down for the figure it plots (such as Sign-ins or Changes logged).
- Top values: the most frequent values of the field chosen in its drop-down (such as Application or Category), each with its count and share, beside smaller lists such as Users with failed sign-ins, Failure error code, and Failed source IPs.
- Breakdown table: every value of that field in the range (Application 2 of 2 values), with Value, Count, and Share.
- Daily counts: one table per source with a row per day and a Total row, and a column per figure.
Breakdown lists keep the top 100 values a day, so the footer notes that long-tail totals are lower bounds.
Microsoft 365 Resource Inventory
URL path: /v2/reports?kind=dashboard&name=m365-resource-inventory&from=<YYYY-MM-DD>&to=<YYYY-MM-DD>&tab=overview
The archive-backed report of Office365_Resource_Inventory_Report, with the refresh button Refresh inventory report. Its figures are the directory as of the latest archived day; its note adds that MFA registration is not MFA enforcement and that the user lists name people.
- Tabs (in the URL as
tab=): Overview (overview), with the Users, Devices, App registrations, Enterprise apps, and Groups counts; Users without MFA (users): Enabled users with no MFA registered, with Finding and Type filters, a page-size drop-down (25 / page), Export CSV, and the columns User, Name, Type, Finding, and Directory roles; Licenses (licenses); Applications (apps): app registrations, client secret tests, and enterprise applications; Devices and policies (devices): devices and Conditional Access policies; Groups (groups); Trends (trends), which needs two or more archived days in the range (Only one archived day in the period, so there is no trend yet.); and Coverage (coverage): one row per scan, with Scan, Source (its table, such asoffice365User), State, and Detail.
CrowdStrike Falcon Resource Report
URL path: /v2/reports?kind=dashboard&name=falcon-resource&from=<YYYY-MM-DD>&to=<YYYY-MM-DD>&tab=overview
The archive-backed report of CrowdStrike_Resource_Report, with the refresh button Refresh inventory report. Its note reads These figures are Falcon hosts as of the latest archived day, never a sum of days. Healthy hosts are counted, not listed. Detections add across the archived daily runs. A missing scan is not zero. On the missing days of an inventory, the coverage band reads Missing days are not an unchanged snapshot: and names them.
SentinelOne Resource Report
URL path: /v2/reports?kind=dashboard&name=sentinelone-resource&from=<YYYY-MM-DD>&to=<YYYY-MM-DD>&tab=overview
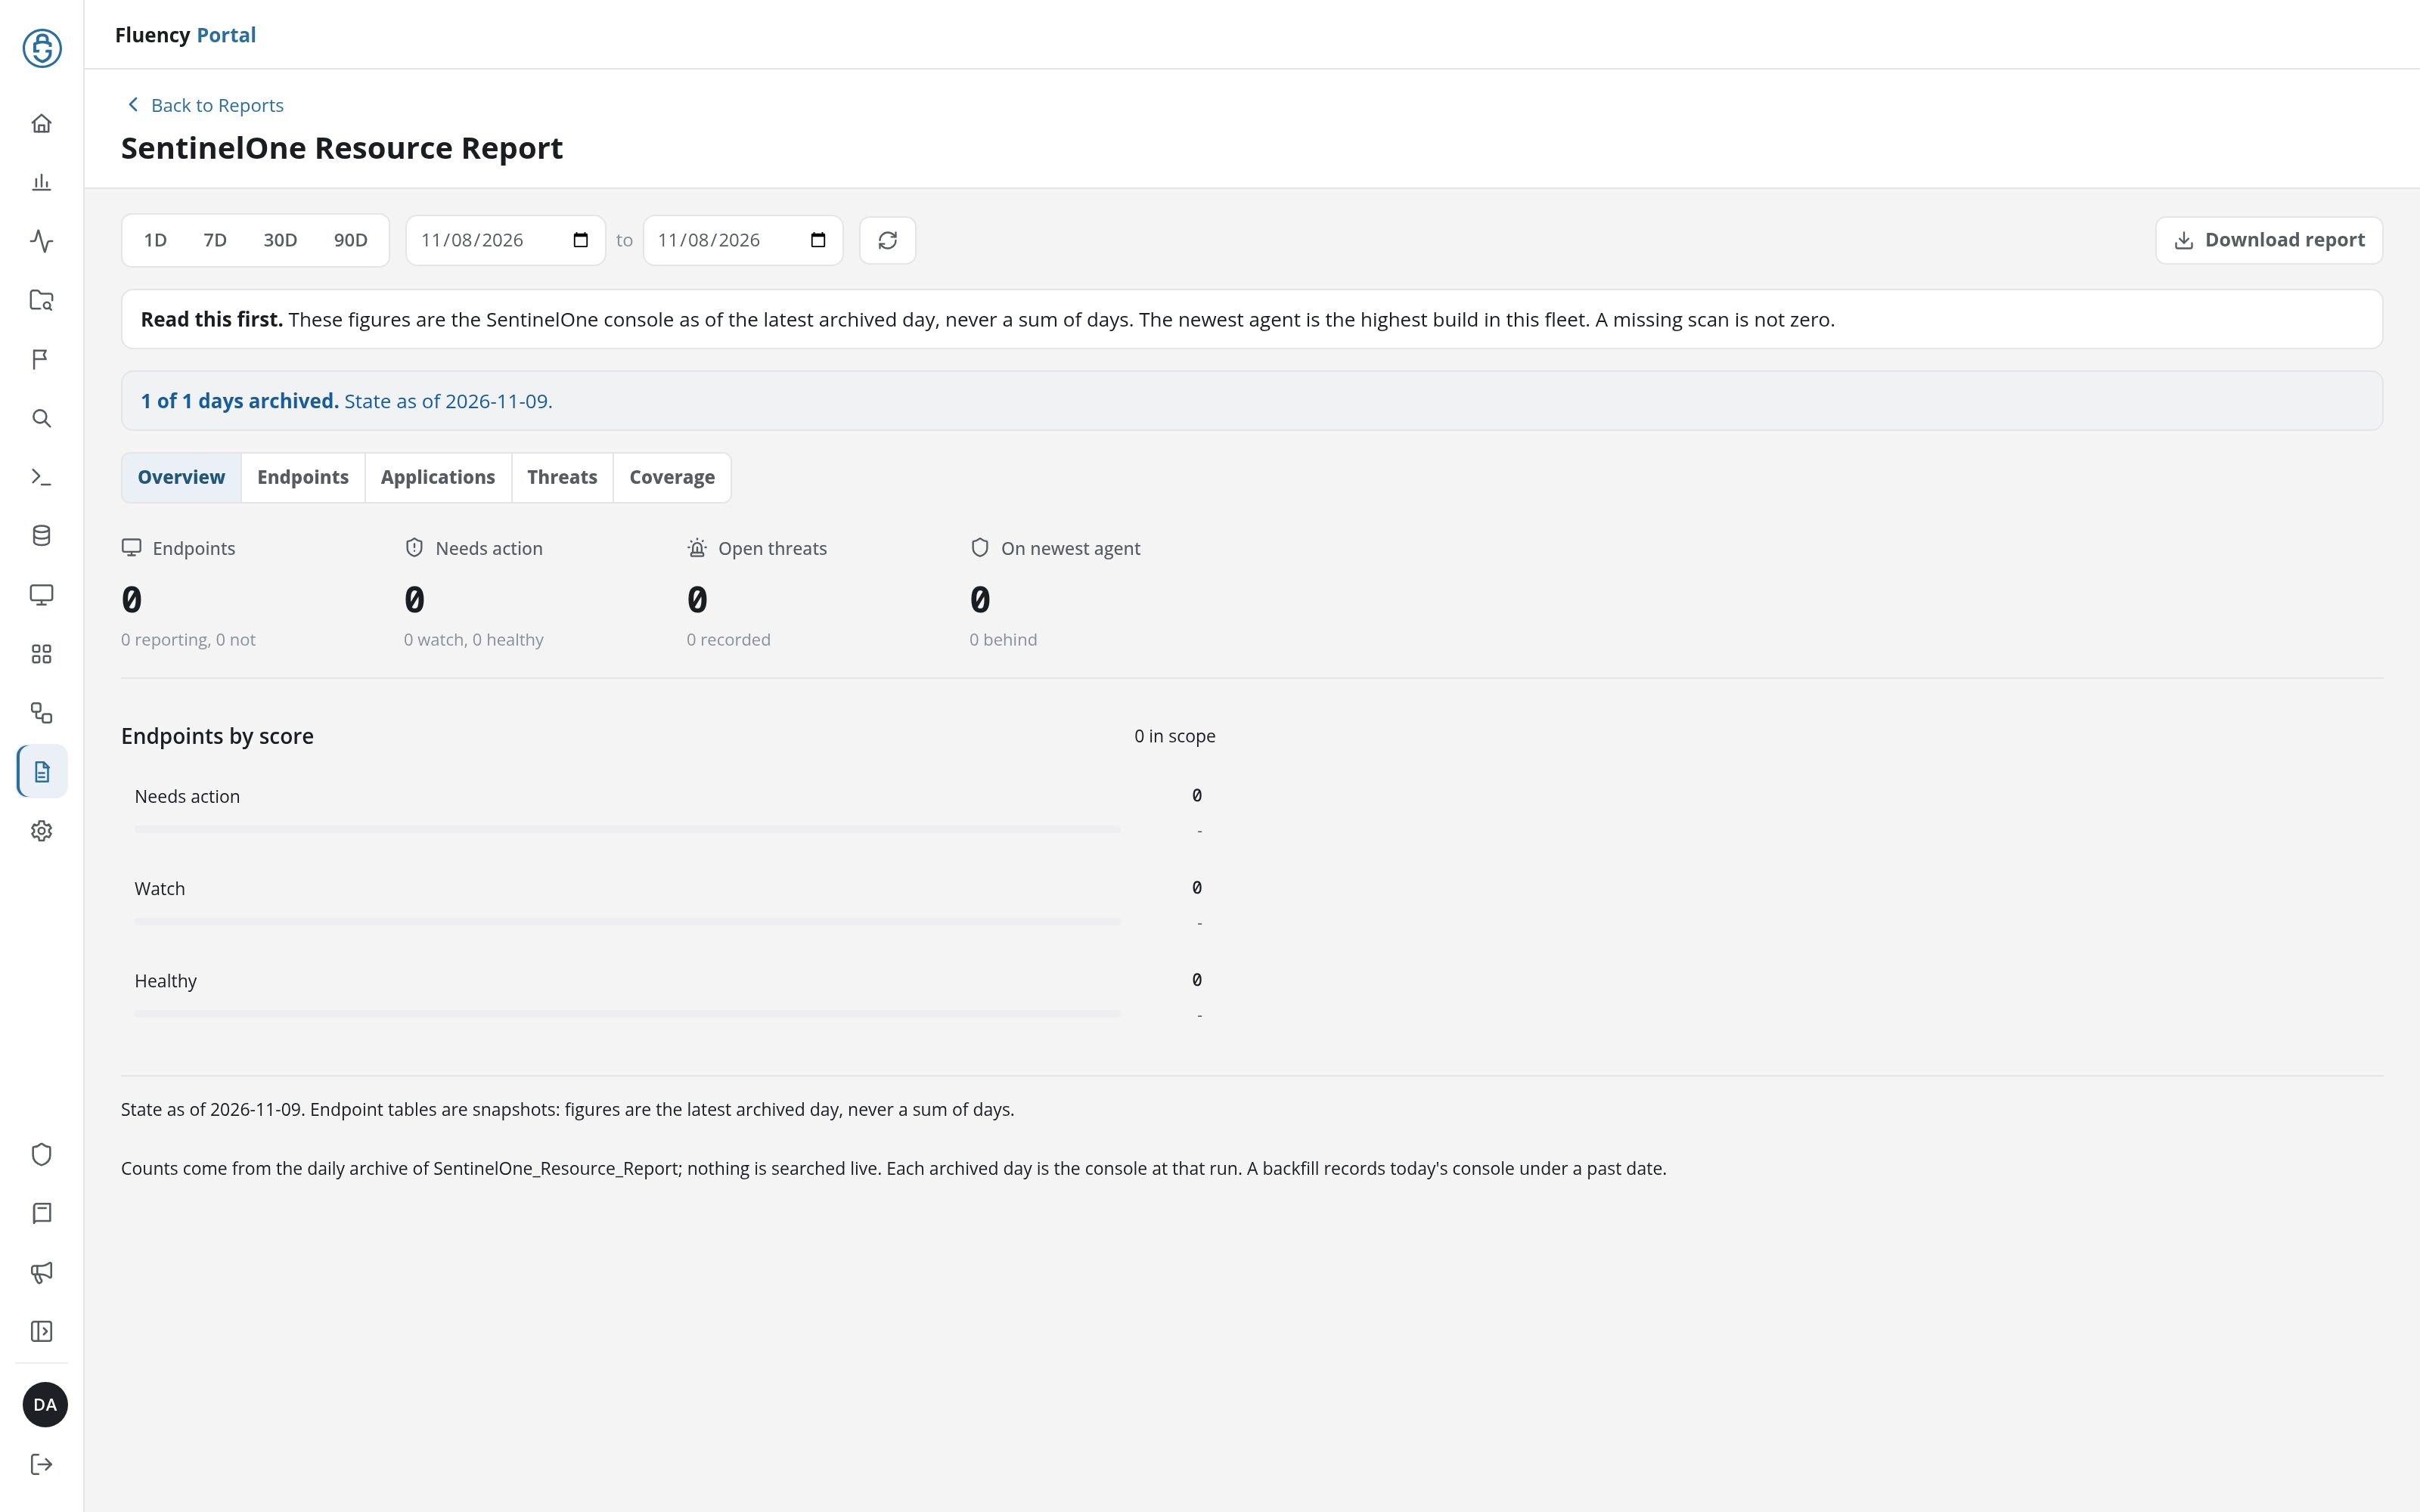
The archive-backed report of SentinelOne_Resource_Report, with the refresh button Refresh inventory report. Its figures are the SentinelOne console as of the latest archived day; the newest agent is the highest build in the fleet.
- Overview (
tab=overview): Endpoints (how many report and how many do not), Needs action (with the counts to watch and healthy), Open threats, and On newest agent (with how many are behind), above Endpoints by score: the endpoints in scope split into Needs action, Watch, and Healthy. - Endpoints (
endpoints): the endpoints with their scores. - Applications (
applications): Installs (with the number of distinct applications), Risky installs, Patch required, and the widespread applications. - Threats (
threats): the Open threats (not mitigated or not resolved) and a Mitigation status table. - Coverage (
coverage): Console over archived days, a row per archived day with Endpoints, Not reporting, Needs action, and Open threats, and the Scans table, as on the Microsoft 365 Resource Inventory.
FPL Reports
The FPL reports tab (FPL report processors for this site.) lists the account's report processors and adds an + Add Report button to the header.
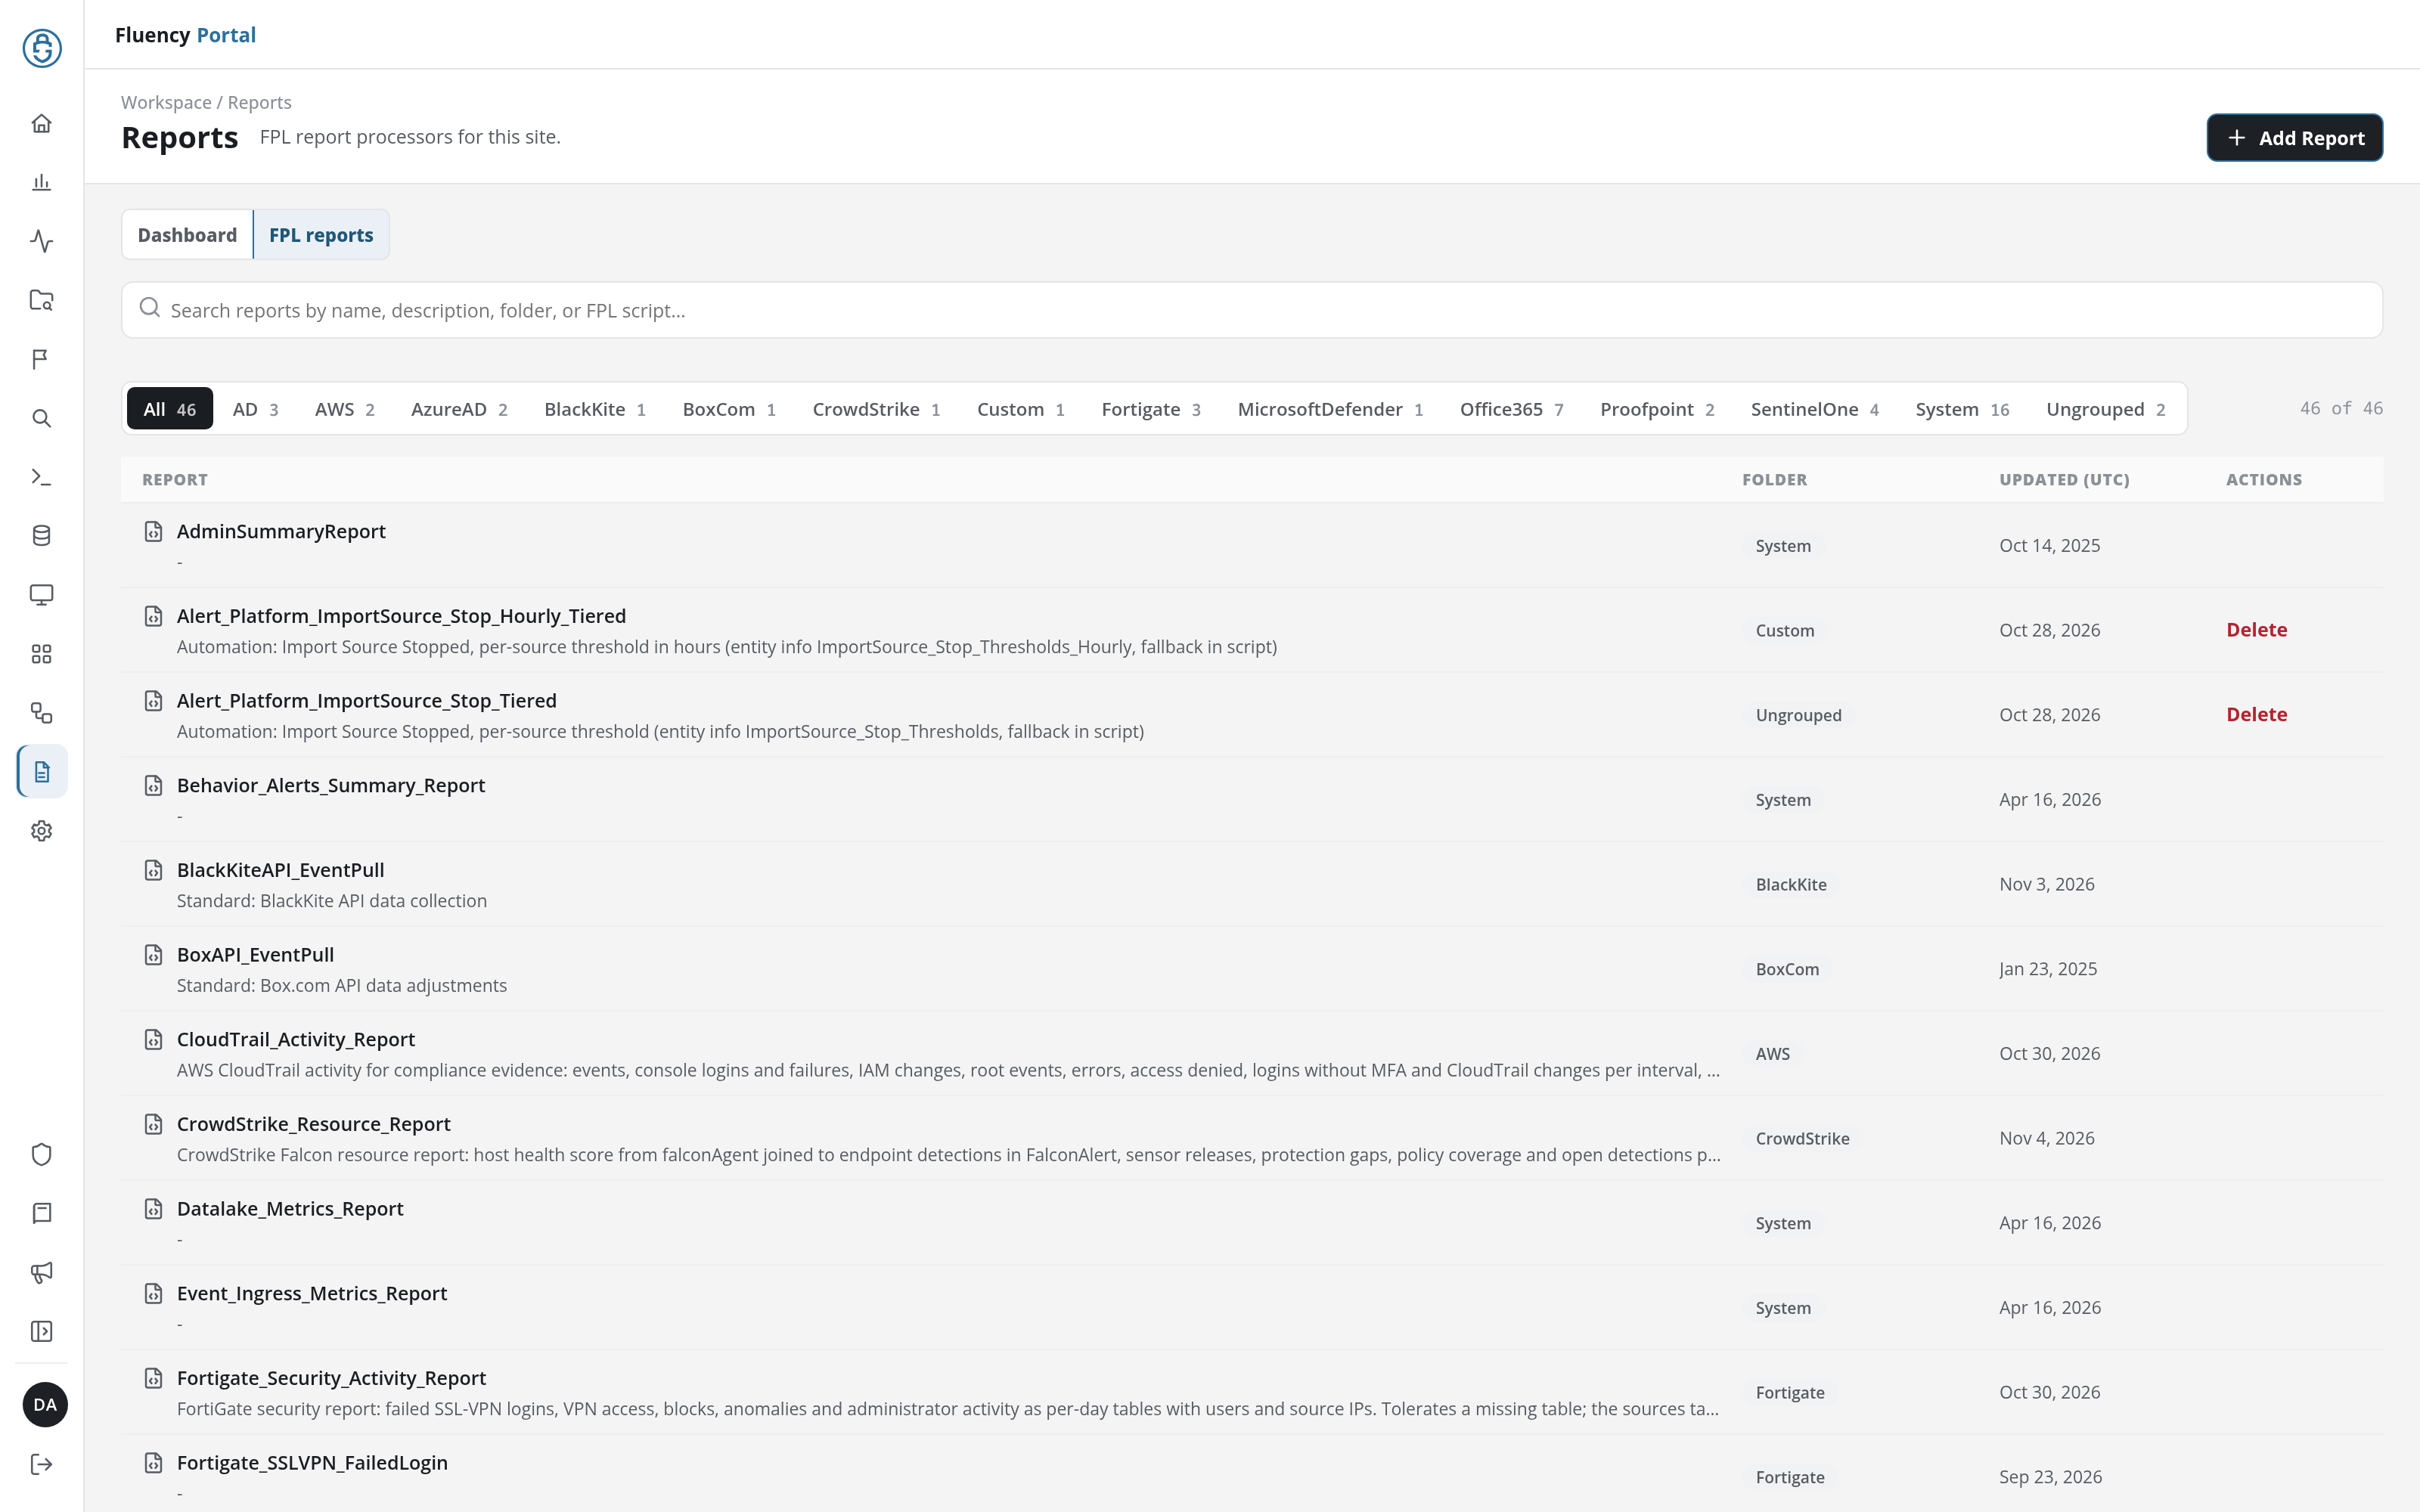
- Folder filters: All and one button per folder, each with its report count (for example AD, BoxCom, Office365, SentinelOne, and System).
- Search field: narrows the table by name, description, folder, or the text of the report's FPL script.
- Report table: Report (the processor's name, with its description beneath it, or - when it has none), Folder (Ungrouped for a report in no folder), Updated (UTC), and Actions. Click a row to open the report in the editor. When nothing matches the search or folder, the table reads No reports match this filter.
- Delete: in the Actions column of a report created on the site (in a folder such as Custom or Ungrouped); system reports have none. It deletes the report after a confirmation.
Report Editor
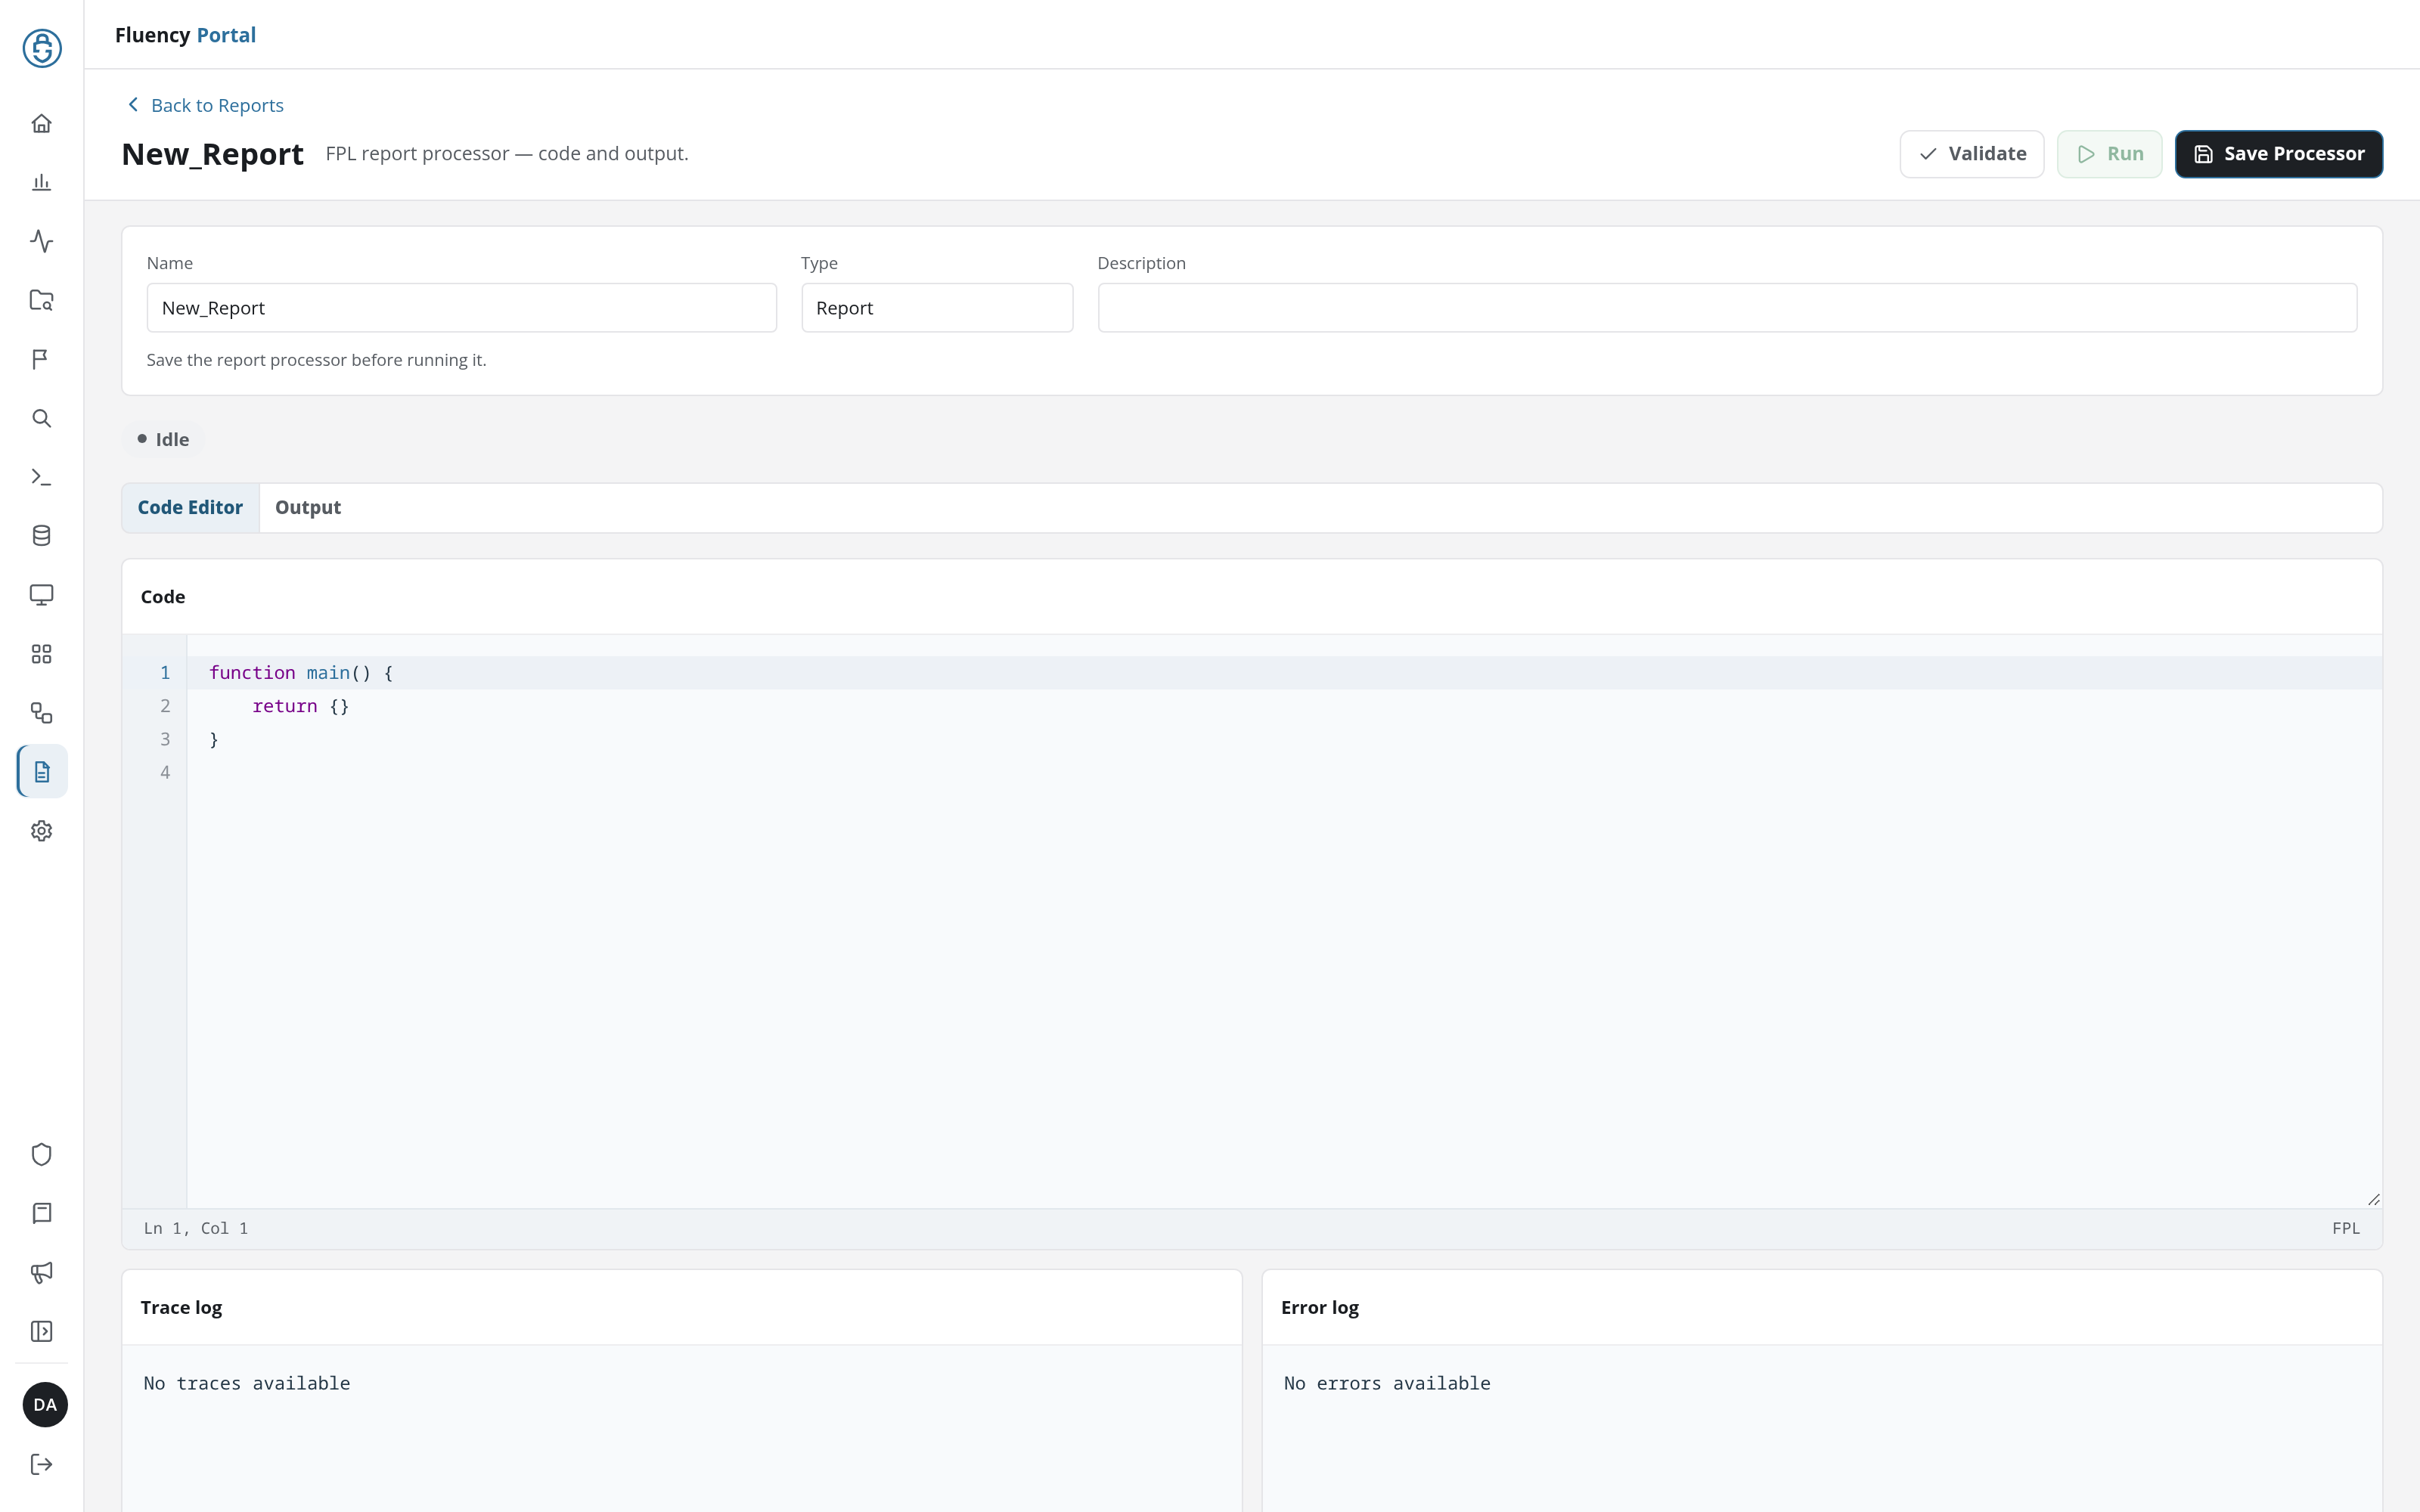
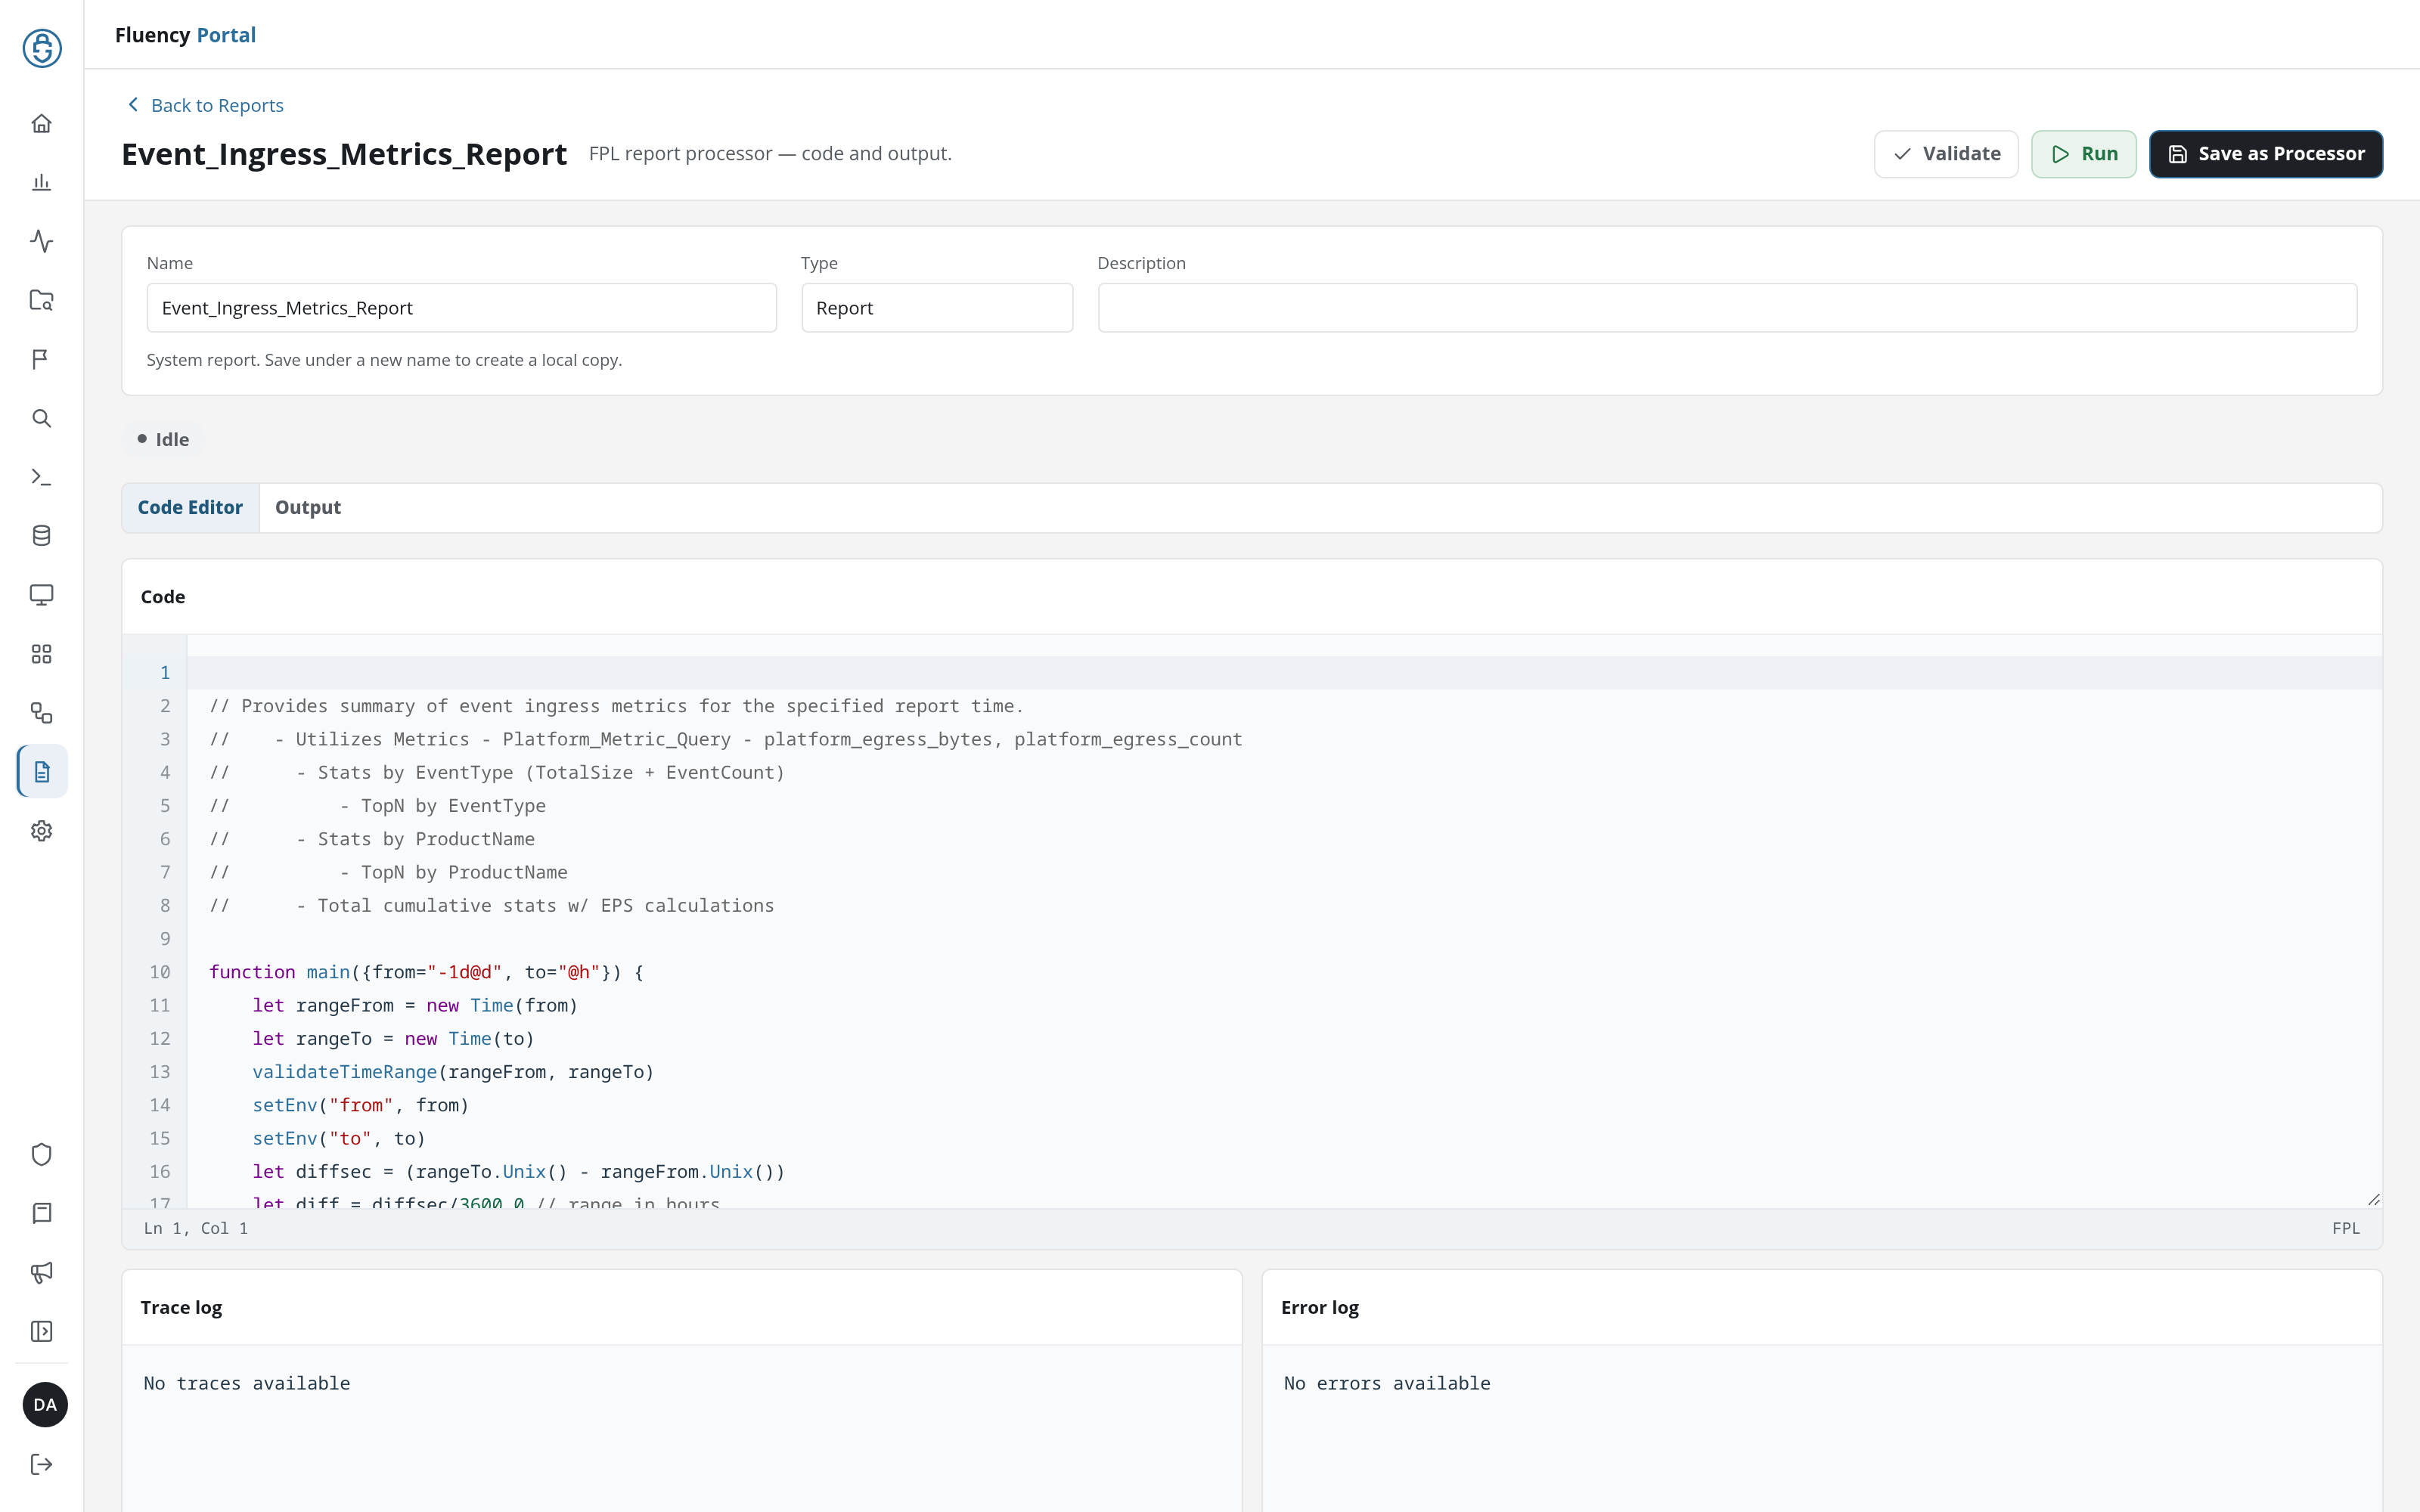
+ Add Report opens the editor on a new report (/v2/reports?kind=fpl&action=add) titled New_Report, with the subtitle FPL report processor – code and output. Opening a report from the table shows the same editor with that report's code.
-
Back to Reports: returns to the FPL reports list.
-
Name: the report's name, prefilled with
New_Reportfor a new report. -
Type: Report, read-only.
-
Description: free text.
-
Status: the run state beneath the fields, Idle while the report is not running. Until a new report is saved, the note Save the report processor before running it. sits beneath the fields and Run is greyed out.
-
Code Editor / Output: tabs for the code and for the report's output. The Output tab reads No output available until there is output to show.
-
Code: the FPL source, with line numbers, and the cursor position (Ln 1, Col 1) and the language (FPL) in its footer. A new report starts with an empty
mainfunction:function main() {return {}} -
Trace log and Error log: the trace and error output of a run; No traces available and No errors available until there is some.
Buttons sit in the header's upper-right corner:
- Validate: checks the report's code without running it. A green notice reads Validation successful., or a red one gives the parser's error, which also fills Error log (for example
line 2:2 mismatched input 'return' expecting …). - Run: runs the report's code, once the report is saved; see Running a Report.
- Save Processor: saves the report under its Name, and is greyed out while Name is empty. Once the report is saved, a green notice reads <name> has been saved., the URL becomes
/v2/reports?kind=fpl&name=<name>, Name turns read-only, and the button reads Update Processor. Update Processor saves later changes, with the notice <name> has been updated. - Delete Processor: last, in red, on a report saved on the site (not on a system report): deletes the report after a confirmation.
A system report (one supplied with the platform) opens with the note System report. Save under a new name to create a local copy. beneath its fields, and its save button reads Save as Processor.
A report saved on the site opens with its Name read-only and its save button reading Update Processor. A Prior runs drop-down at the right of the status reads No selected run ▾; it lists the report's earlier runs (<date and time> by <user> (ID:<run ID>)), and choosing one loads it as described under Report Runs.
Running a Report
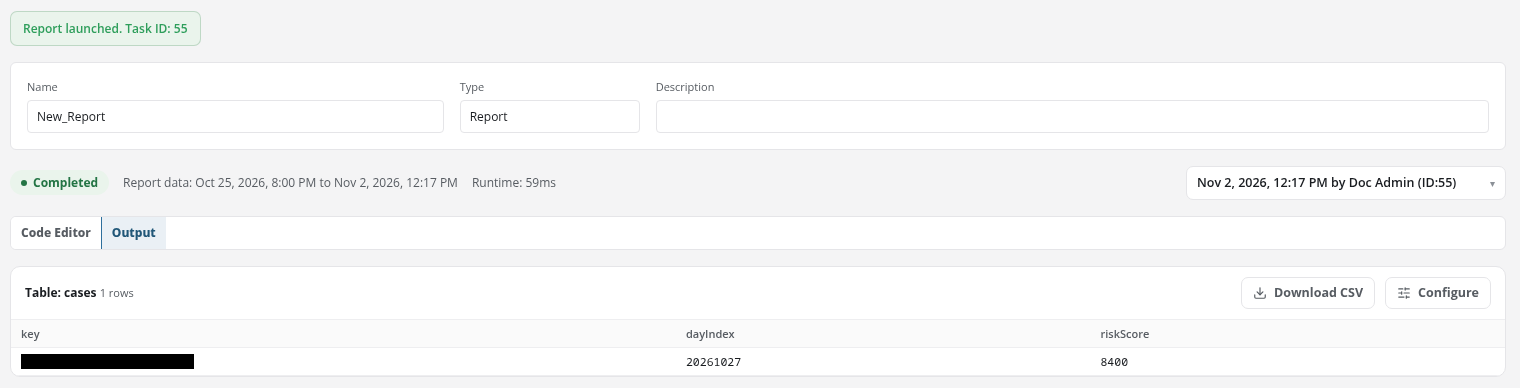
Run starts a saved report with the code in the editor. A new report cannot run until it is saved: Run stays greyed out under the note Save the report processor before running it. A green notice reads Report launched. Task ID: <run ID>, and the URL gains the run (/v2/reports?kind=fpl&name=<name>&id=<run ID>). The editor then shows the run as described under Report Runs: its status badge (such as Completed), Report data: <start> to <end> (the time range the run read, in local time), its Runtime, and the run selected in the Prior runs drop-down, with the page switched to the Output tab. Lines the code writes with printf appear in Trace log, on the Code Editor tab. Every run is also listed on Report Tasks.
Report Runs
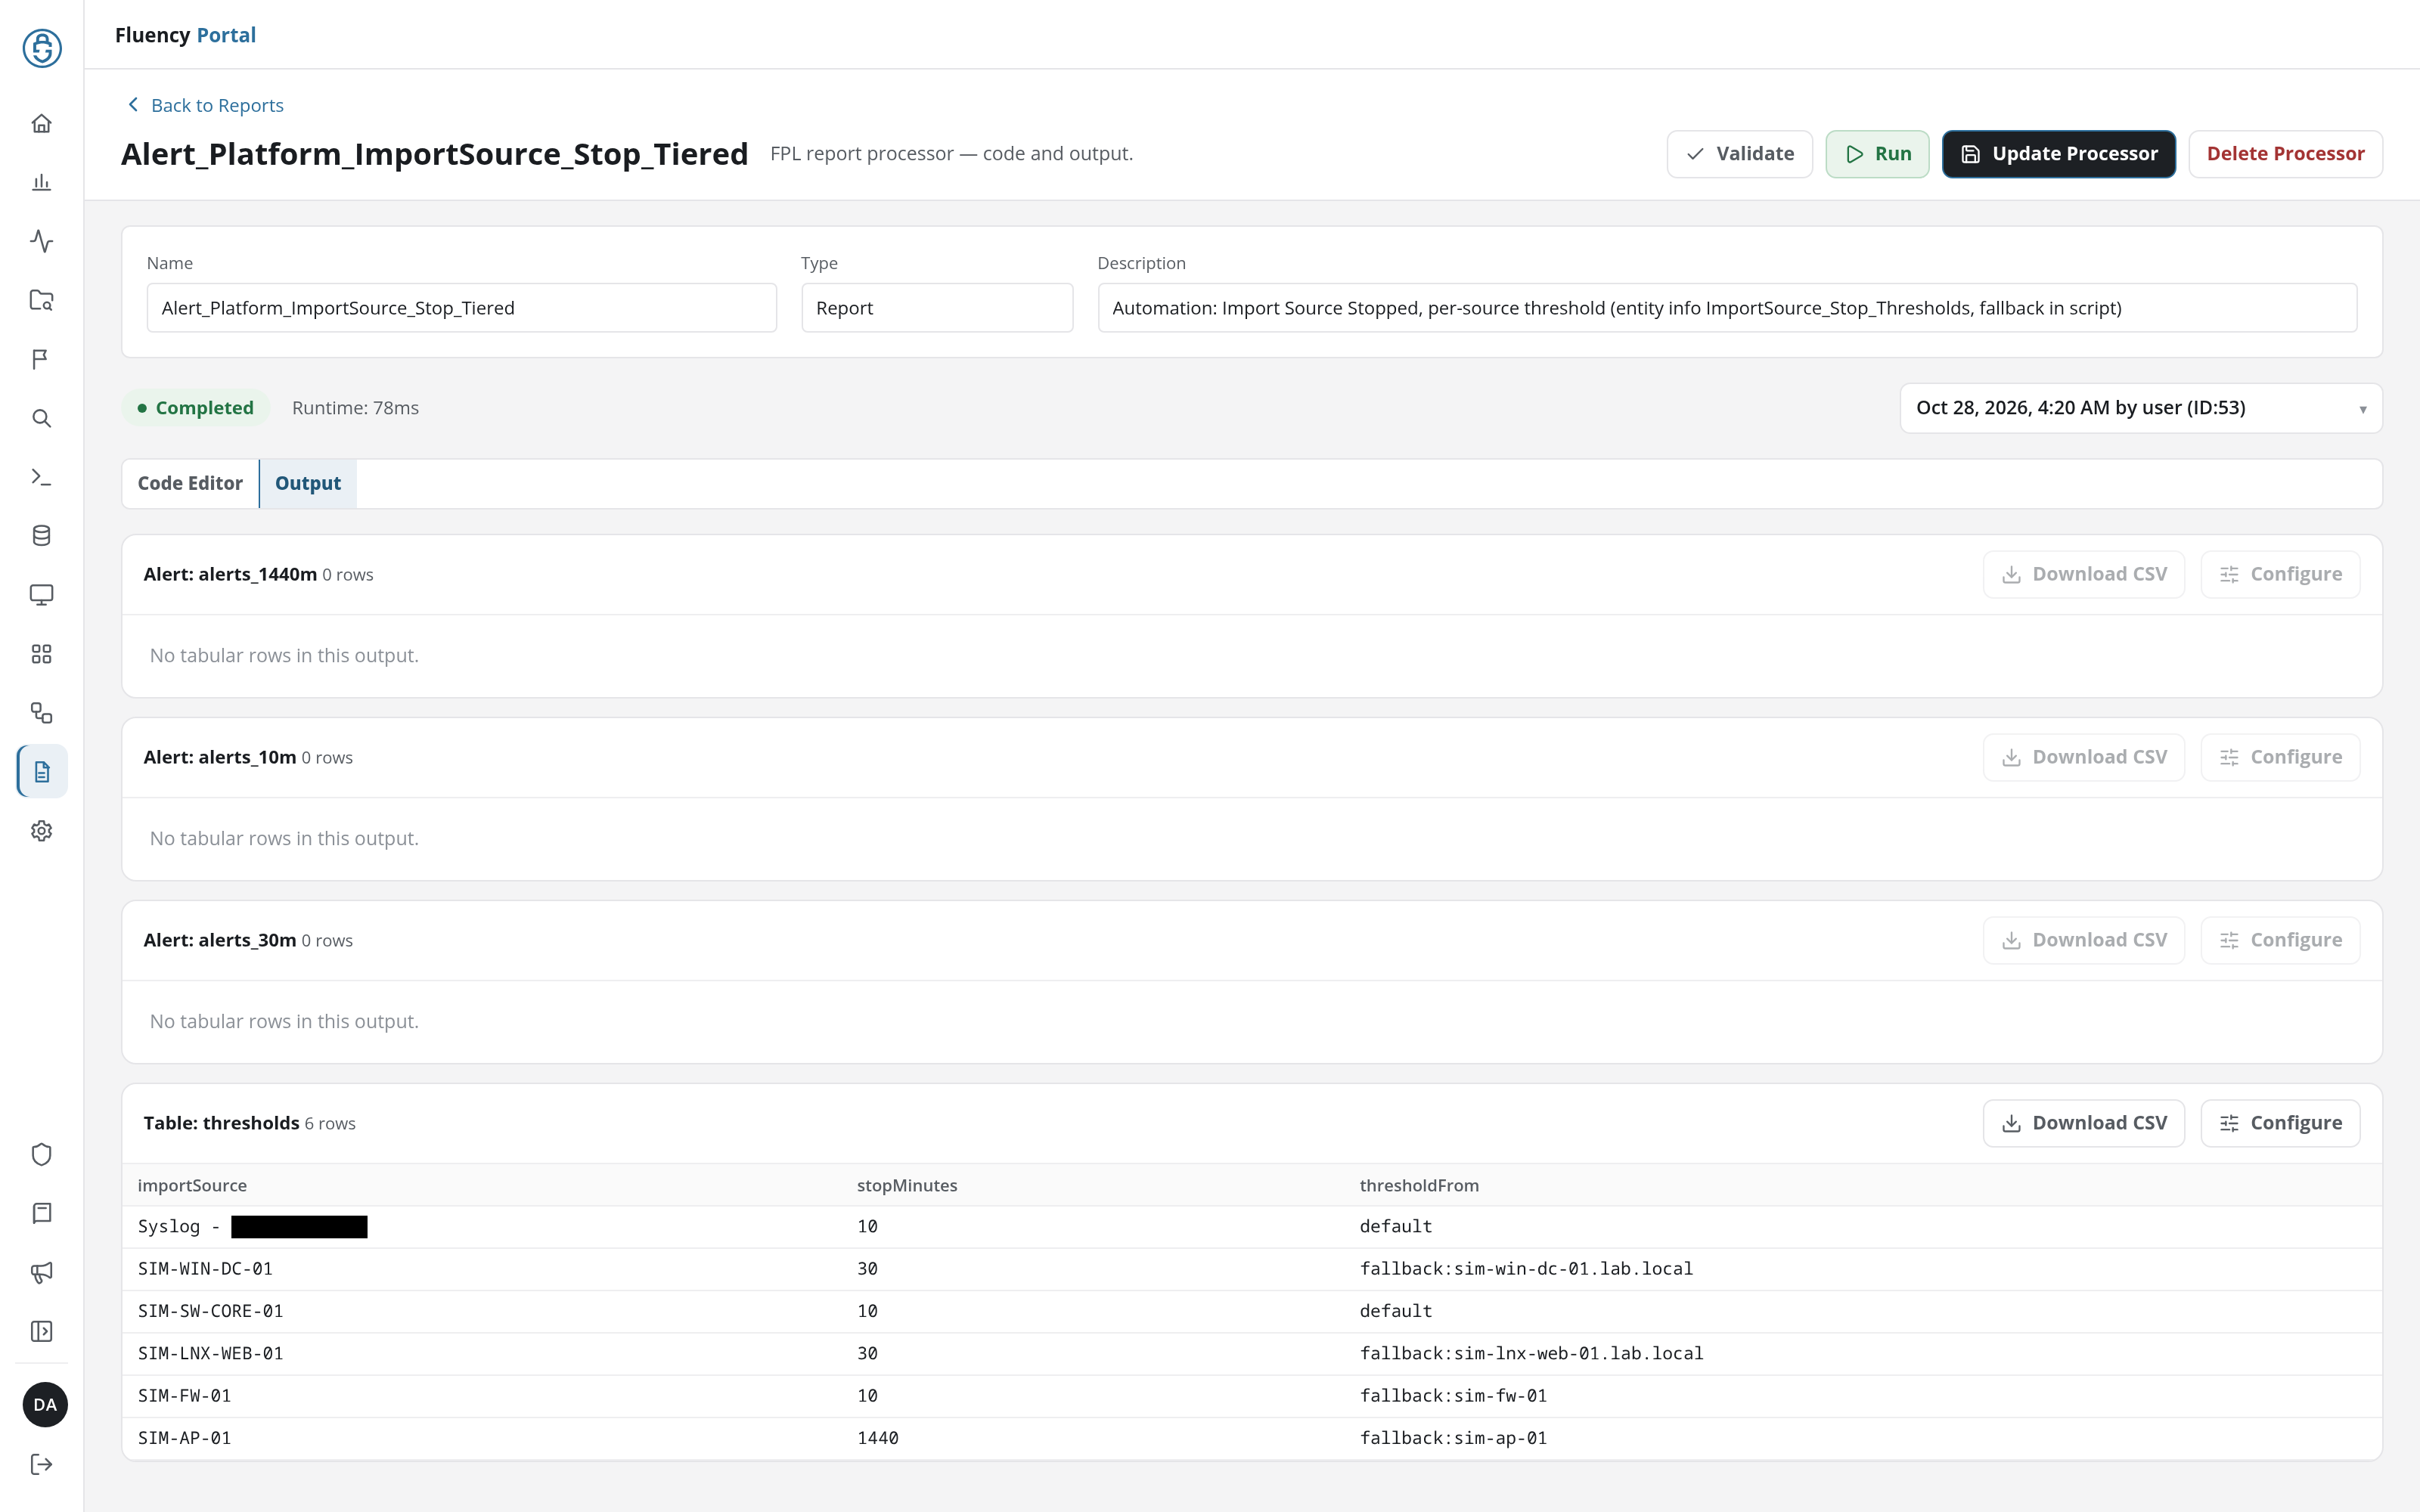
A row on Report Tasks opens the report with one of its runs loaded, at /v2/reports?kind=fpl&name=<report name>&id=<run ID>. The editor then shows that run's results:
- Update Processor: the save button, beside Validate and Run in the header, followed by Delete Processor on a report saved on the site.
- Run status: beneath the fields, in place of Idle: the run's status as a badge, such as Completed, and its Runtime (for example Runtime: 89 ms).
- Prior runs drop-down: at the right of the status, the run loaded: when it ran, who ran it, and its ID (
<date and time> by <user> (ID:<run ID>)). - Output: the tab the page opens on, with one section per output of the run. Each section is headed by the output's kind and name (Alert: or Table:) and its row count, and has a Download CSV button and a Configure button, both greyed out when the output has no rows. Beneath the heading, the output's rows fill a table with one column per field (click a column header to re-sort it), or the section reads No tabular rows in this output.
Download CSV and Configure
An output section's Download CSV saves its rows as <output name>.csv, a comma-separated file with a header row and quoted values.
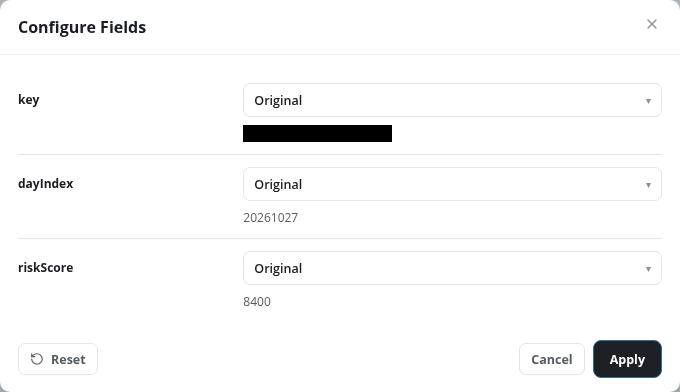
Configure opens the Configure Fields dialog, with one row per column of the output: the column's name, a Format for <column> drop-down, and a sample value beneath it. The formats are Original (the default), Bytes (KiB, MiB), Comma-separated number, Timestamp (UTC), Duration (milliseconds), and Floating point. Apply reformats the table on the page (for example 8400 as 8,400); the formats are not saved with the report. Reset and Cancel sit beside Apply at the foot of the dialog.