Reports
Creating a report takes three steps: writing it in the Fluency Programming Language (FPL), creating its widgets, and scheduling it; see Creating a Report and Scheduling and Delivery. The finished reports are read as dashboards and sent to export destinations, as described in Dashboards and Delivery and Exports.
- v2 interface
- Classic v1 interface
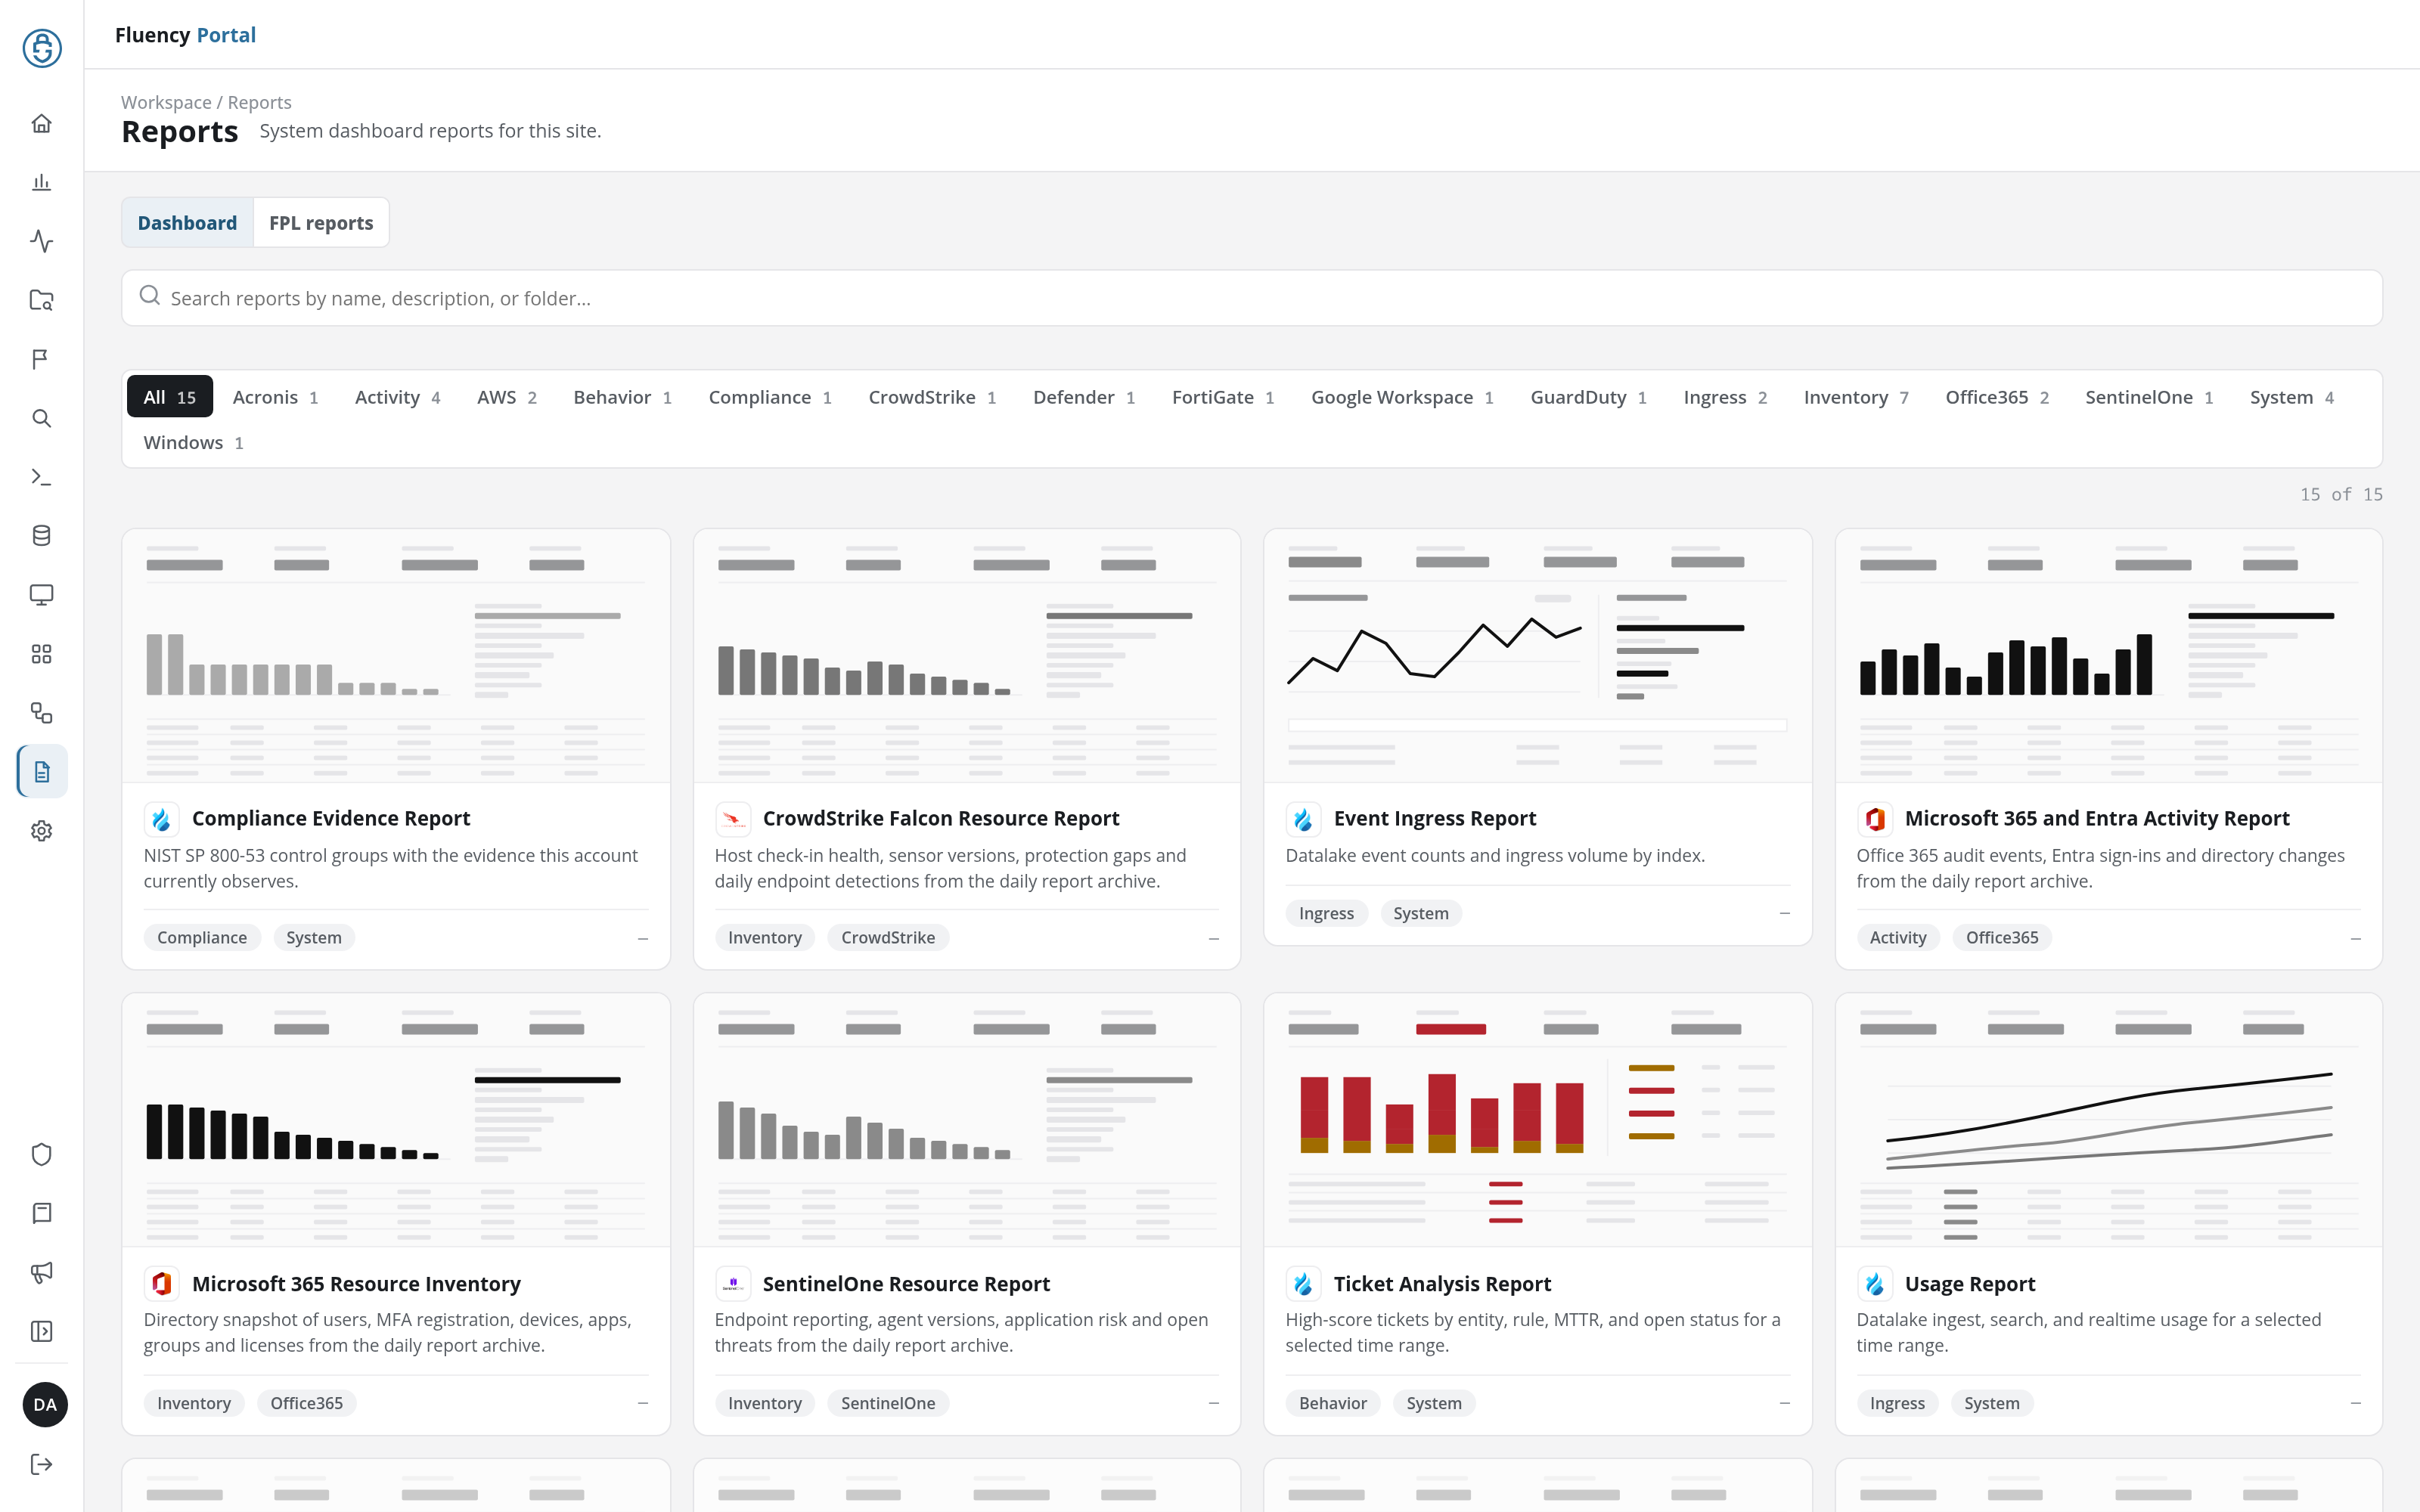
The Reports page (/v2/reports) opens on its Dashboard tab (System dashboard reports for this site.) with a card for each dashboard report: the system dashboards (Event Ingress Report, Ticket Analysis Report, Usage Report and the Compliance Evidence Report) and the archive-backed dashboards for Microsoft 365 and Entra ID, AWS, Google Workspace, Acronis, CrowdStrike, SentinelOne, Microsoft Defender, FortiGate and Windows Server, each opening as an interactive dashboard over a time range you choose. An archive-backed dashboard opens once its scheduled report is archived for the account. Its FPL reports tab lists the account's report processors. An FPL report is scheduled on Configuration → Report Scheduler, and every run is listed on Admin console → Report Tasks. See Reports.
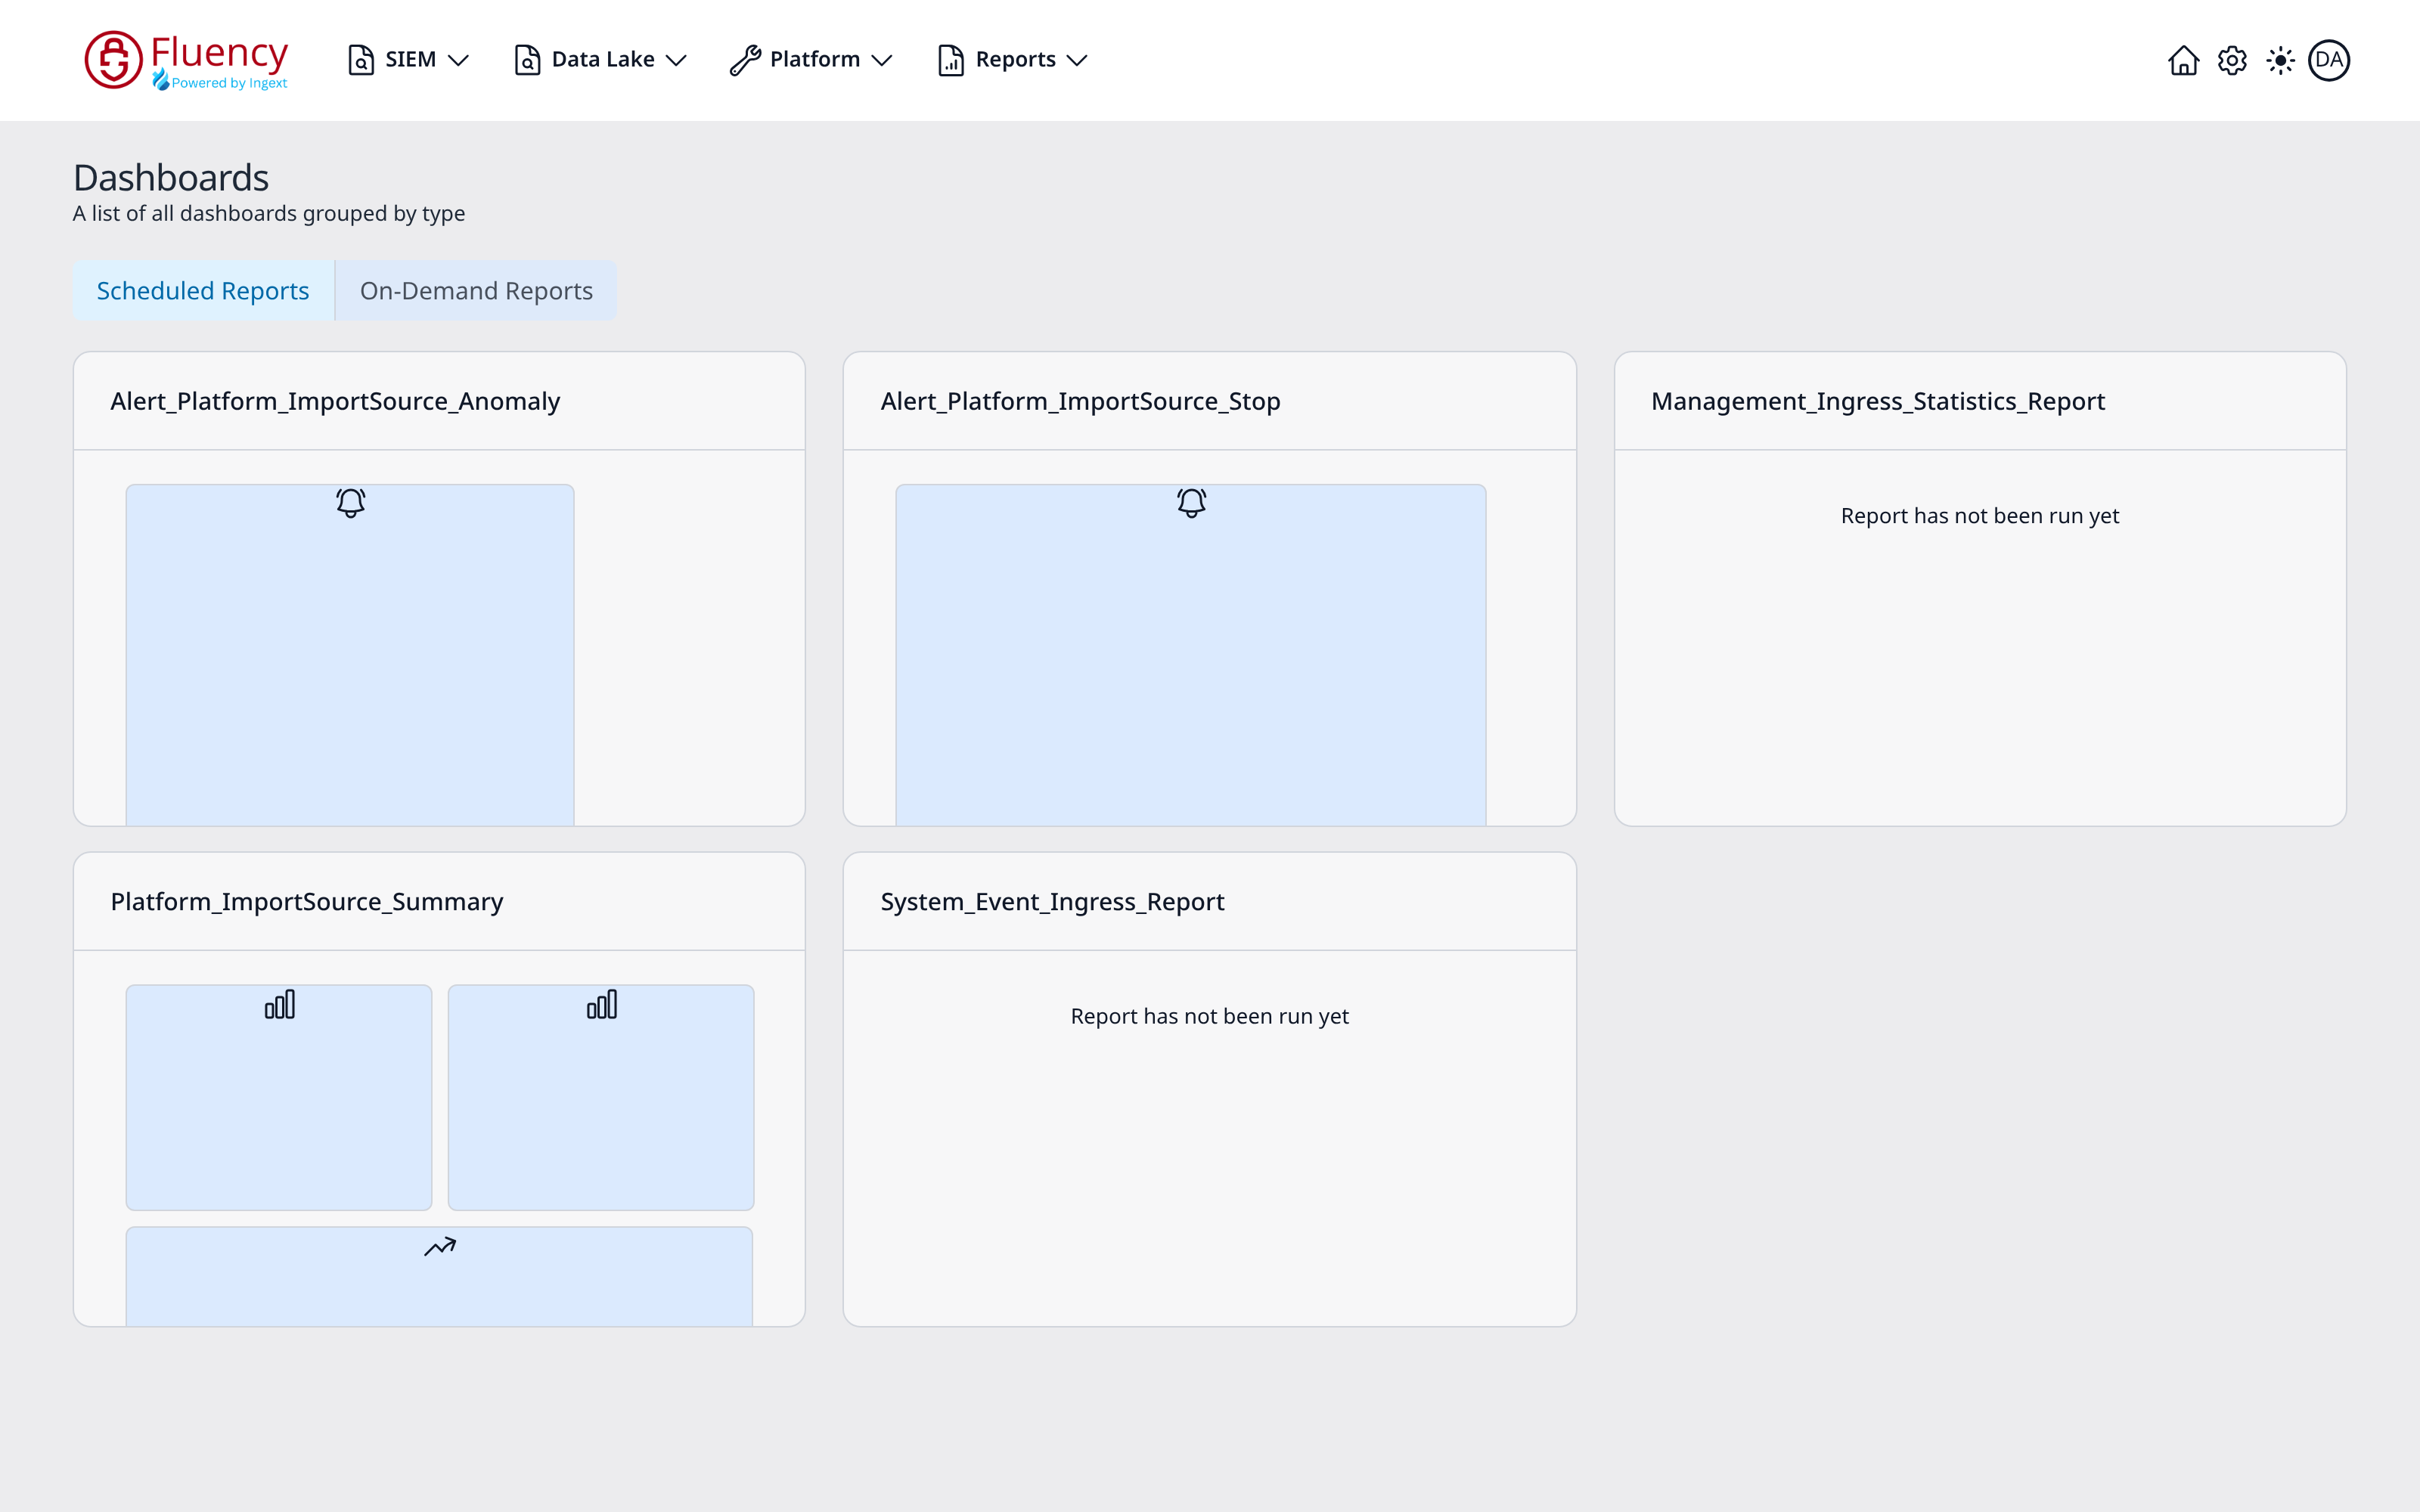
The Reports → Dashboard page (/reports/Dashboard, titled Dashboards on screen) groups dashboards into two tabs (Scheduled Reports, selected by default, holding the reports that have been scheduled, and On-Demand Reports, holding the reports that are run manually) and lays each group out as a card grid, three cards per row. A card that has run shows thumbnail tiles of its widgets; one that has never run reads Report has not been run yet.