Configuration
This page shows platform configurations: Data Sources, Routers, and Data Sinks. The page is divided into two portions: a sidebar on the left and graphic illustration (3 columns) on the right.
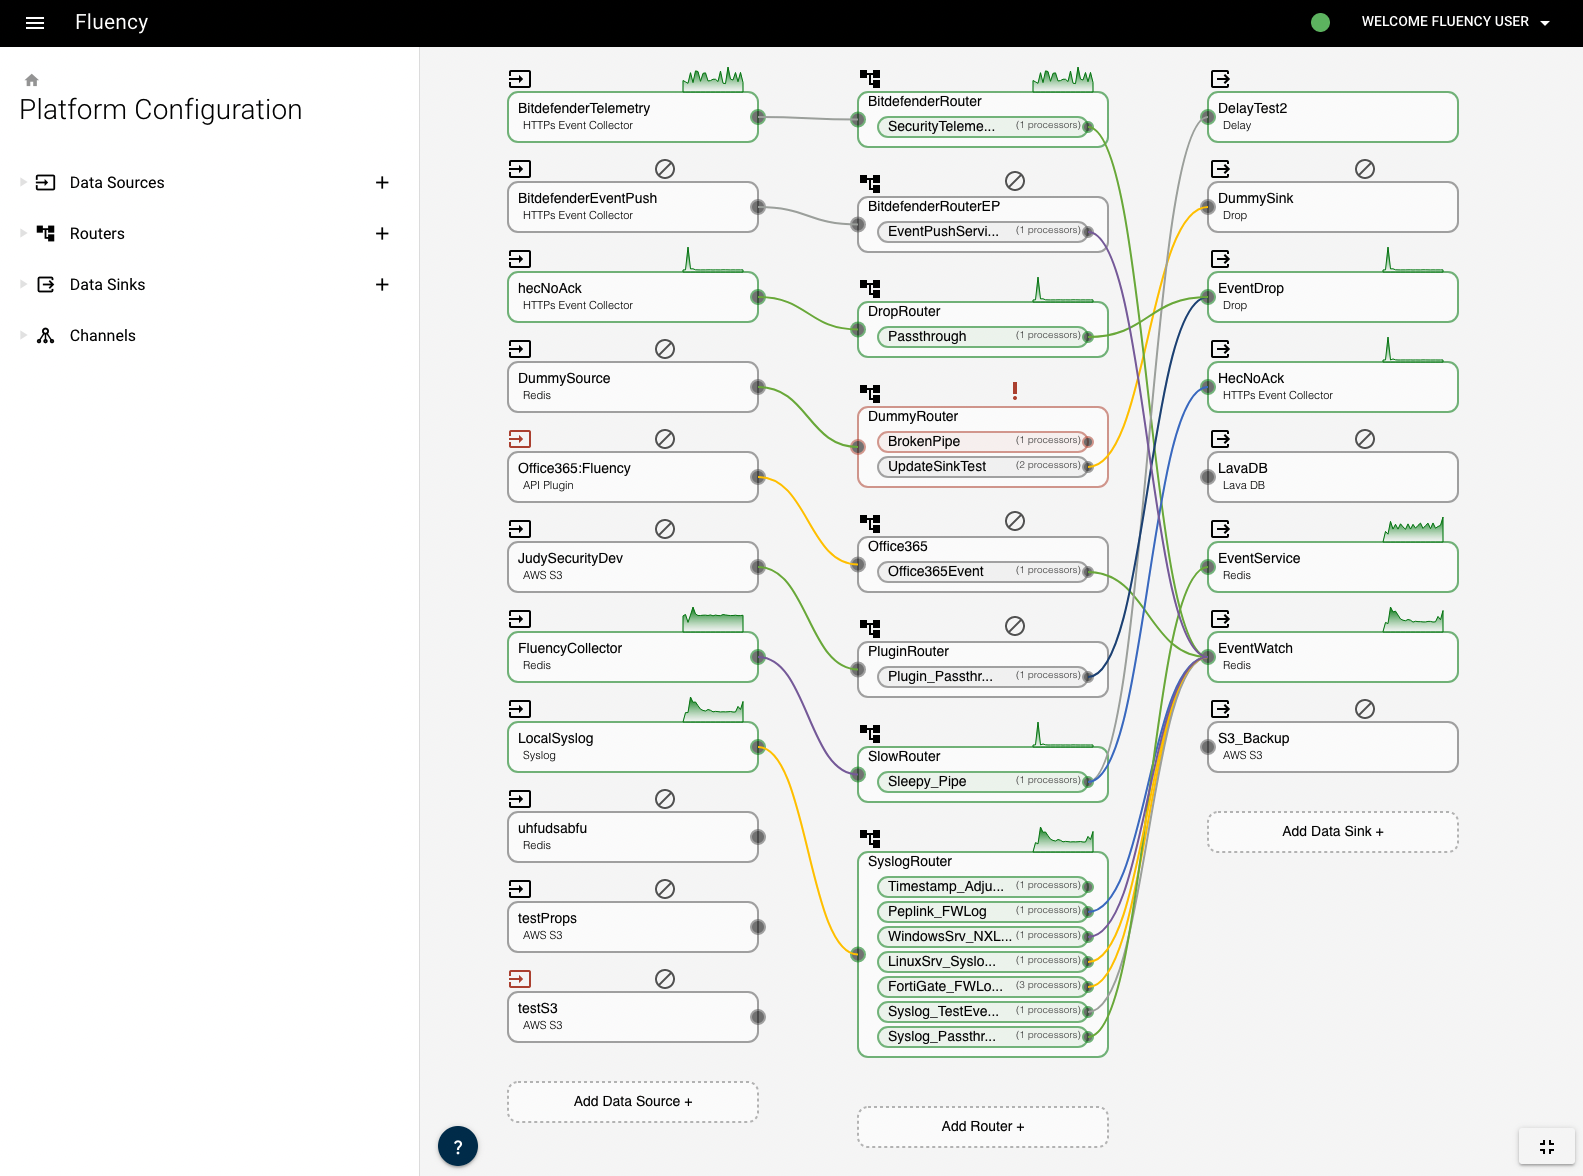
From the right side, we can see data sources include types of HTTPs Event Collector, Redis, API plugin, AWS S3 and syslog, etc. Each data source needs a router (second column). Each router contains 1 or more pipes, and each pipes contains 1 or more processors. Data sinks include types of Delay, Drop, HTTPs Event Collector, Lava DB, Redis and AWS S3, etc.
To the upper right of the names of data sources/router/data sink, the green and grey symbols indicate "active" or "not data" in the past 24 hours. The green histogram shows the input bytes.
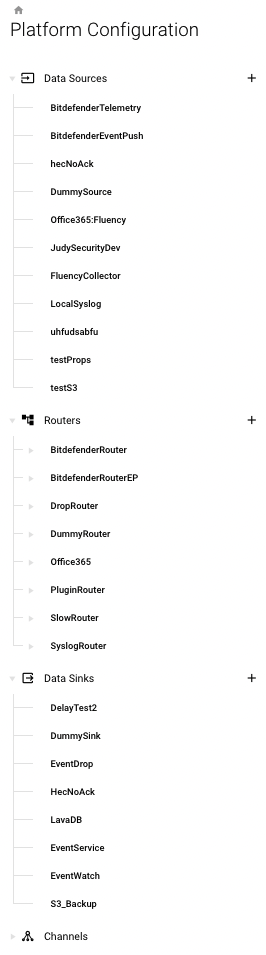
The sidebar on the left contains the same information as the graphs. Click the texts to expand the contents.
In the figure above, clicking each row will show more details, including source details, connection, states, traces, event metrics, event logs and tags of a data source/router/data sink. Take "FluencyCollector" (data source) for example:
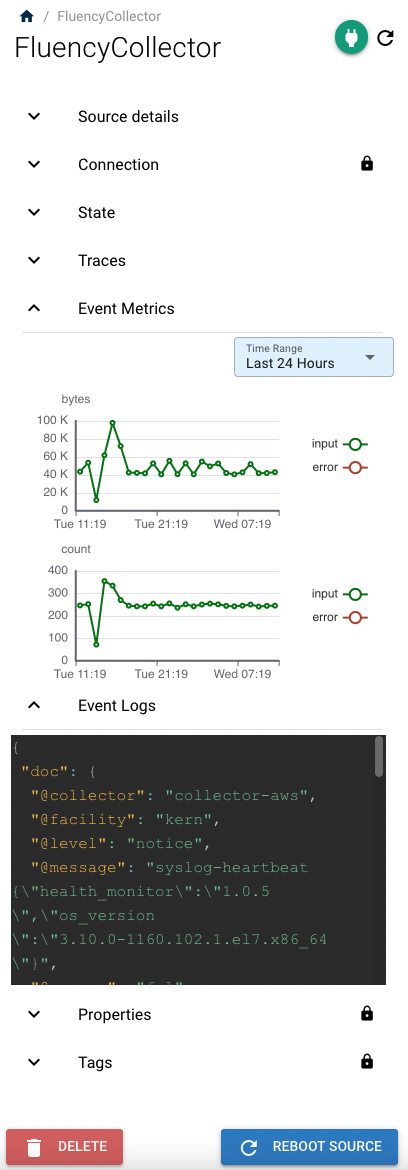
The information above, can also be shown if you click the text "FluencyCollector" on the right side of the page (first column).
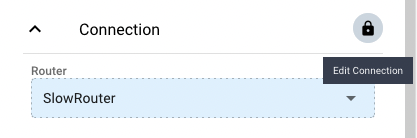
Click each row to expand more details and edit some of them. For example, here we click "Connections". In the figure below, you can click the button on the right to edit the connection, otherwise it's locked.
In the end, the colorful lines connecting the some of the boxes among the three columns on the right side of the page indicates the connection between data sources, routers, and data sinks. You can also add more data sources, routers, or data sinks by clicking the "+" button at the bottom of each column.