Network Flows
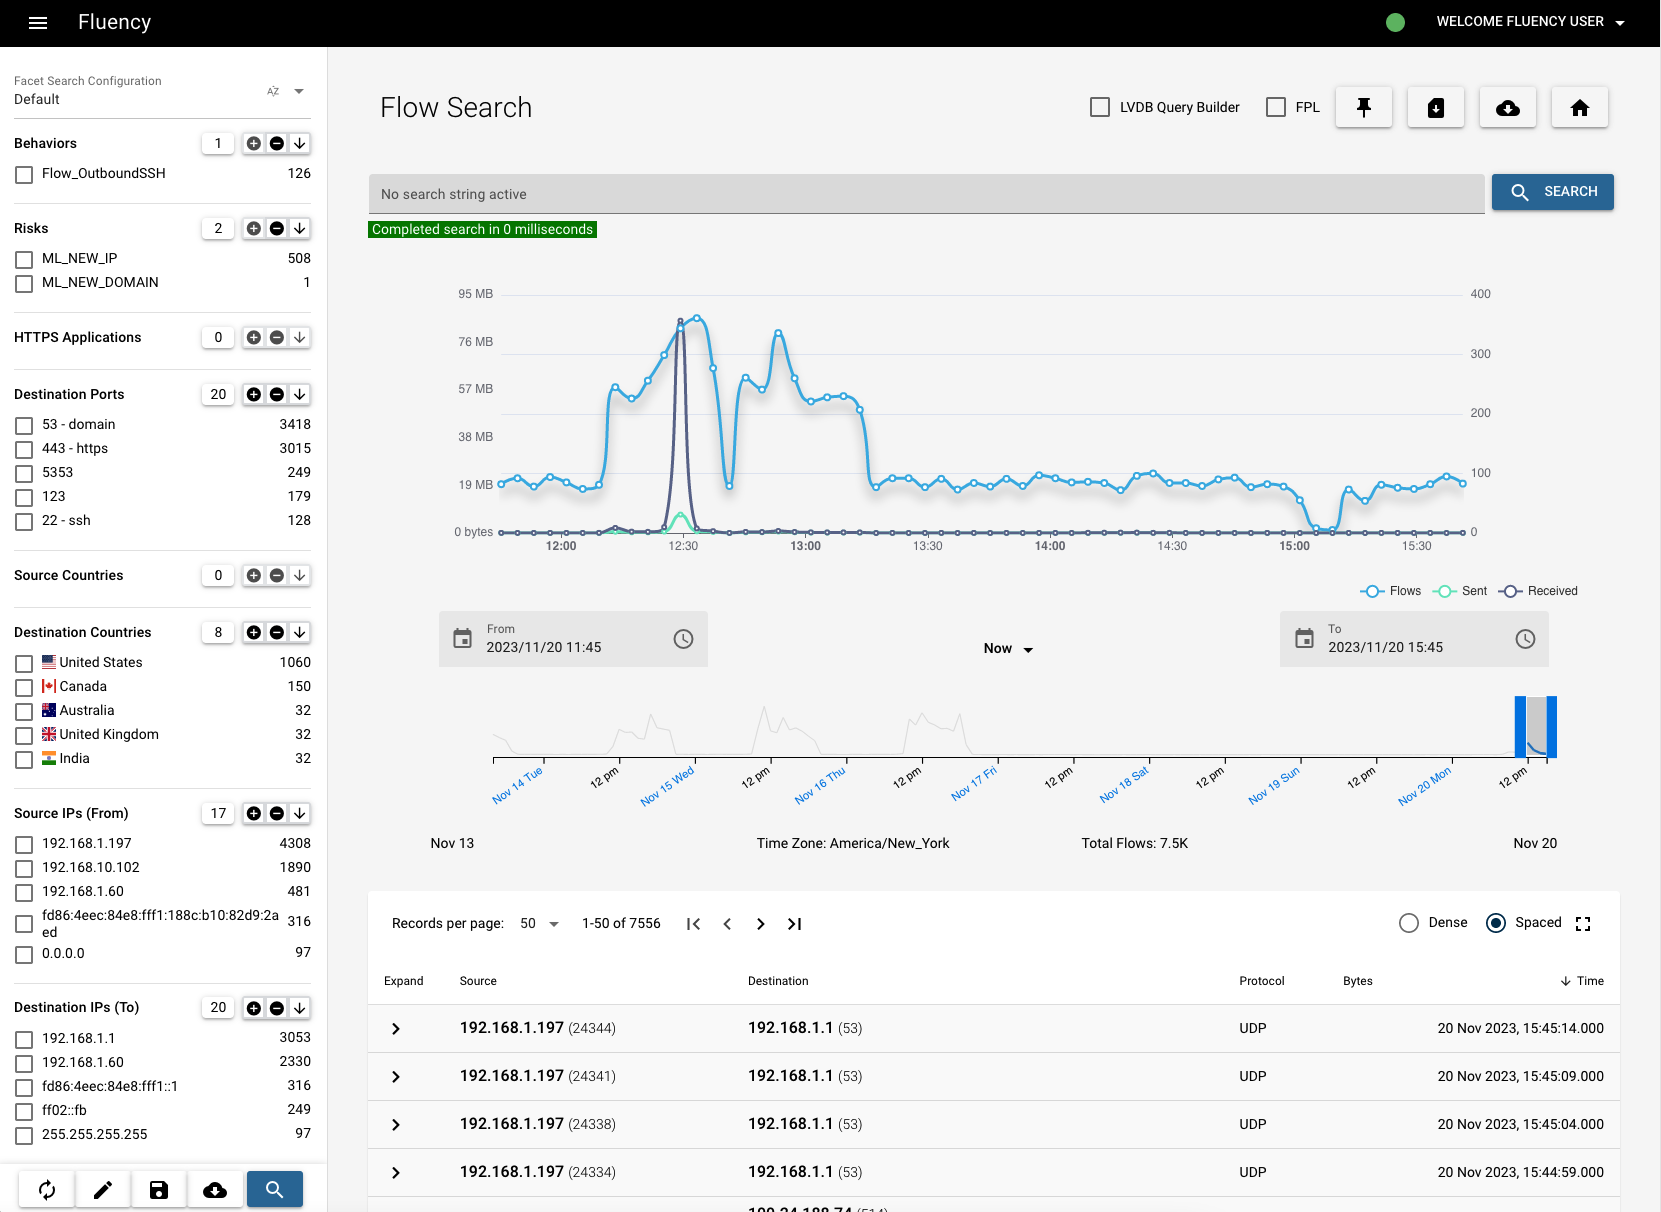
This page has the normal "three part layout" of menu bar, facet and workspace.
There are two types of message (log) data stored in Fluency: the event (raw) data and the flow data. Flow data is merged data. Data in the last 90-days is kept in a warm state and the first time navigating to Network Flows page will take longer than follow-up searches, which are hot.
In the upper right corner of, there's a pin icon which is seen throughout Fluency. Clicking it will force the current page to generate a new tab instead of navigating away when you click anything else.
When navigating from the menu, a default four (4) hour time window with an empty search is used.
Refer to: Flow Search.
Flow Table
Basic Flow Elements
Network Addresses (Source and Destination addresses)
It is common to see either IPv4 or IPv6 data here. To the rights, in parentheses, is the port assigned to that address in the flow. This, with the time window and protocol, creates a tuple used for correlation.
It is possible that a network communication uses something other than IP addresses. In this case, the source and destination identifier is used. Examples would be datalink level flows and cell data flows.
Hostname/Passive DNS/Referrer
This field is populated with the HTTP header host field. At times a passive field is presented on a flow too. The difference is the host field is the name the protocol is calling the destination, while the passive is what the network DNS is calling the destination. Also, a referer might show up. This is the value of the HTTP referer field that shows what page called this page.
Protocol
This is the transport layer protocol used for the communication. The three most common are UDP, TCP and ICMP. If the layer is uncommon, the numeric value will appear.
Here is a list of the protocols by number.
Time
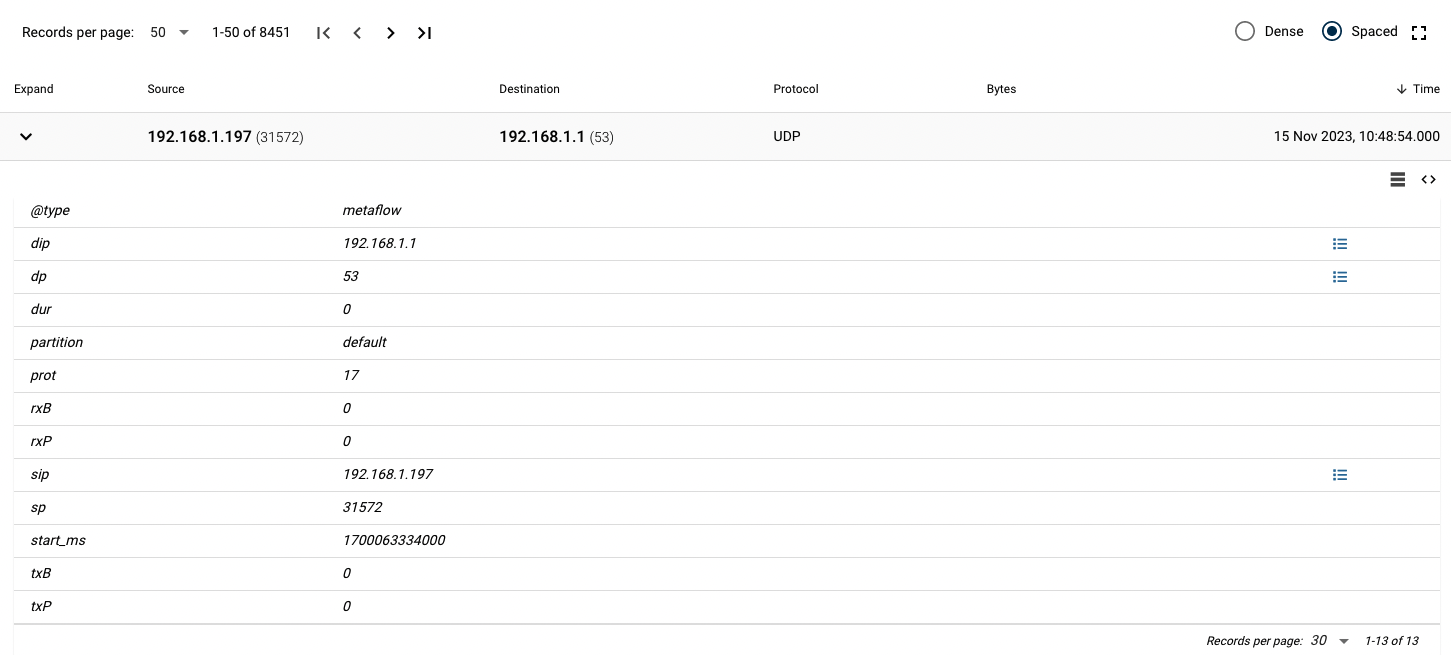
Time will appear as a date and 24-hour time. The date is in US format of month-day, while the time is in 24-hour time. The time will appear, like the date range, as the time zone of the browser. To see the GMT time, use the '< >' icon to see the JSON. Time is in the field start_ms, and is the epoch time of the start of the flow.
Bytes
The bandwidth displays is a combination of four values:
sent > Total < received : time duration
Custom Fields
Devices and protocols that are parsed will add even more fields. All fields can be searched by using the dot notation. See Flow Search for examples. Though there are views for common devices, even fields that do not have views can be searched and added to the facet.
HTTP
| Field | Description |
|---|---|
| Hostname | Hostname in the Host attribute of the header. |
| Request | A direct Child to the host, provides the method, URI and response code. |
| Responded Files | Files that were returned from a request. |
Files
| Field | Description |
|---|---|
| Name | The name of the file (or MD5 if not given). |
| Type | The derived type (by examination) and not the announced type. |
| Size | The size of the file. |
| Positives | Number of Antivirus engines that triggered on this file. |
DNS
| Field | Description |
|---|---|
| Name | The DNS name requested. DNS names are terminated with a period (.). |
| TTL | Time to live is the amount of time a system should cache the result. (answer only) |
| Type | The type of DNS record. |
| Class | The class of the DNS record. |
| CNAME | Canonical Names are used as an alias to either another system name or to the address. |
Time Range
The way to change the time is the data range slider that appears below the zoomed histogram. This slider will change its range based on the two selectors (start and end time) above it. Drag the slider manually or change the selectors can both change the time range.
Below the slider are the start and end dates of the range and the time zone that GMT time is being converted into. Lastly, it shows the amount of flows (records) in the current selection.
Page last updated: 2023 Aug 14