Flow Search
Searching
Each row on Network Flows page (Data Lake -> Network Flows) represents a group of flows that share common attributes; in short, a search.
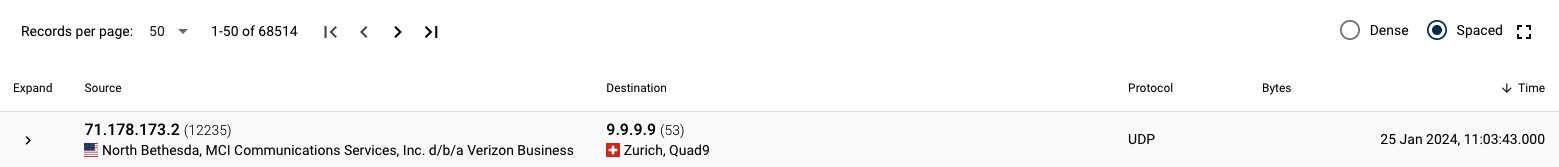
The search used is written in a lucene-like search syntax. This is a powerful way to search data, and more intuitive than SQL. The search syntax is fairly straightforward. Flow data appears in a javascript object notation (JSON) format.
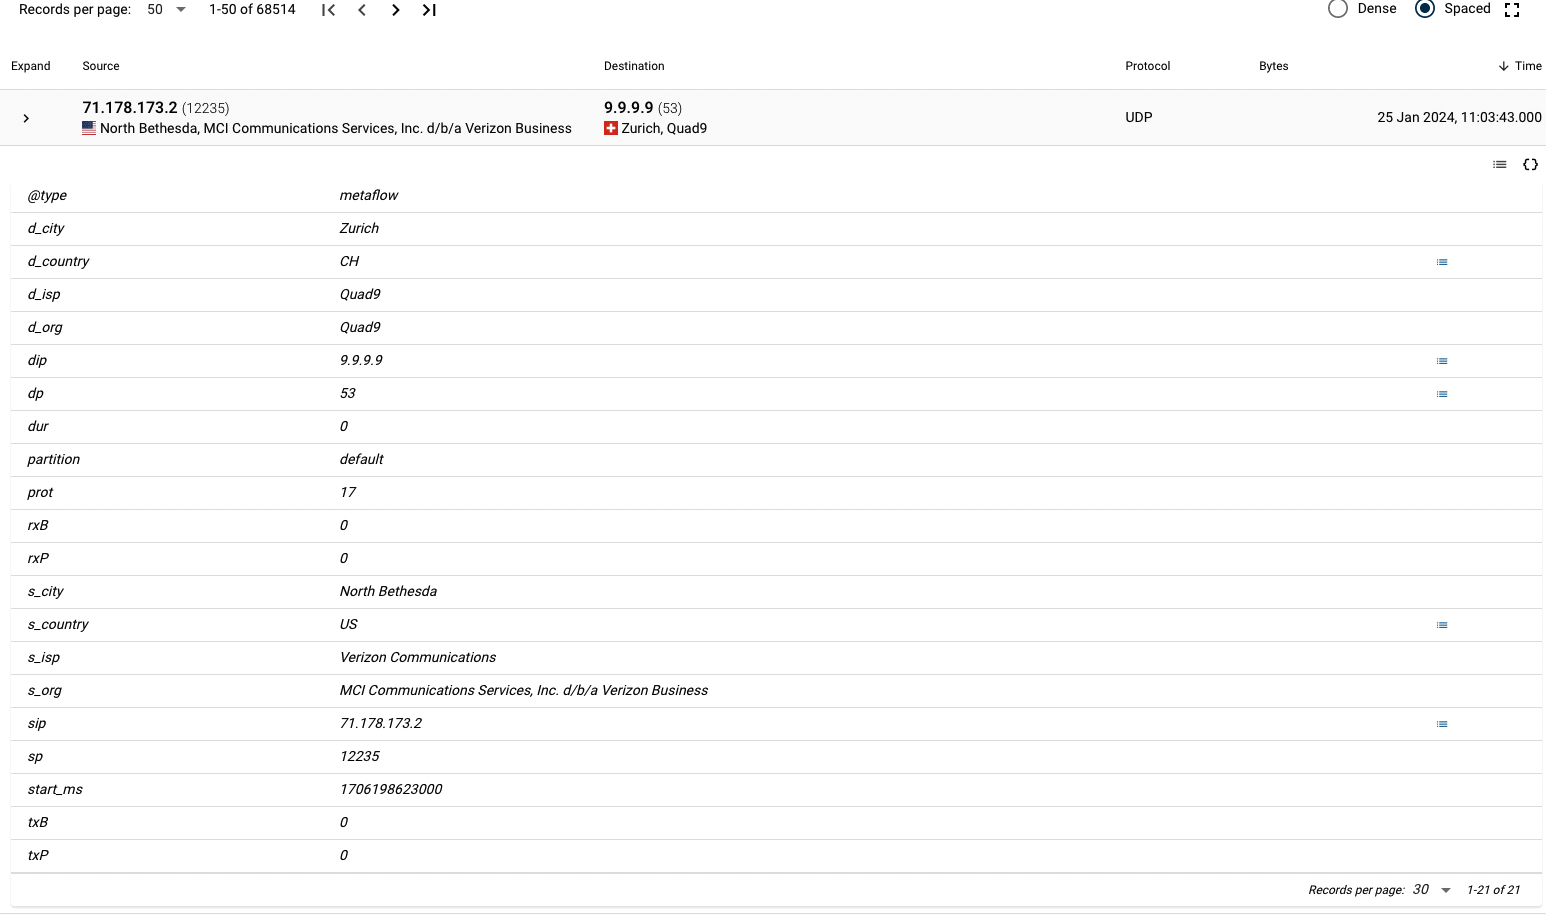
As the picture shown below, for a row, click the expand icon (top left corner, under the text "expand") to show a table format of the JSON record.
When clicking on the code icon < > on the right, the row opens up and JSON can be seen.
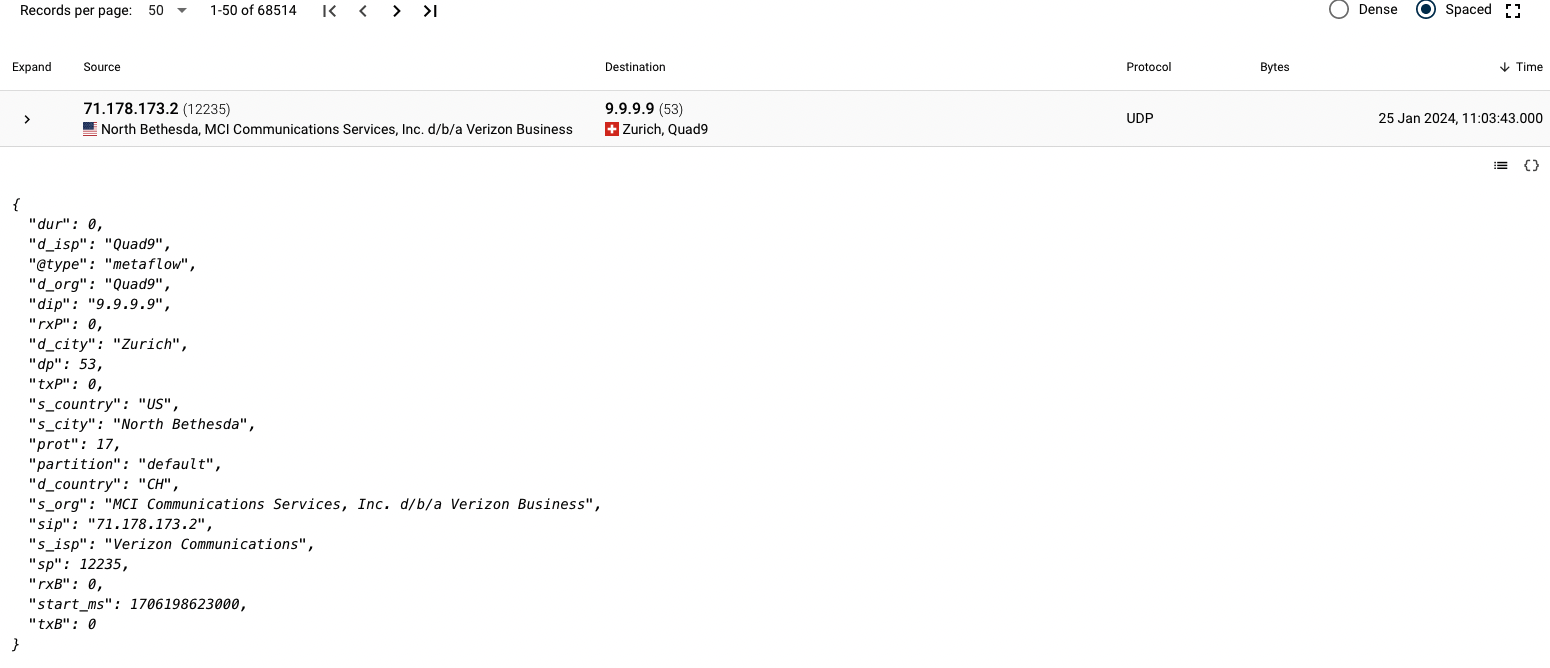
This particular JSON in its entirety looks like:
{
  "dur": 0,
  "d_isp": "Quad9",
  "@type": "metaflow",
  "d_org": "Quad9",
  "dip": "9.9.9.9",
  "rxP": 0,
  "d_city": "Zurich",
  "dp": 53,
  "txP": 0,
  "s_country": "US",
  "s_city": "North Bethesda",
  "prot": 17,
  "partition": "default",
  "d_country": "CH",
  "s_org": "MCI Communications Services, Inc. d/b/a Verizon Business",
  "sip": "71.178.173.2",
  "s_isp": "Verizon Communications",
  "sp": 12235,
  "rxB": 0,
  "start_ms": 1706198623000,
  "txB": 0
}
We can see how much data really is in a simple flow. Fluency keeps a record of data in two formats: flow and event. The difference between these is that events are the uncorrelated direct logs, while flow records are the records of flows with all related events contained in them.
The basics of a flow are called the Tuple. A TCP/IP tuple is composed of a source and destination’s addresses, ports and protocol used, such as TCP or UDP. Every tuple is unique at any given time. Fluency uses the characteristic of tuples to fuse the data into a single document (document being the big data word for record).
There is no communication data in a Fluency flow record unless provided by a reporting system. All the data being displayed, such as how long the communication and the HTTP negotiation, is called metadata. This type of data is used most commonly for behavioral analysis and analytics.
Field-Value Pairings
The most common search is a Field-Value Pairing search. This means we are looking to match a field with a particular value.
In the example above, let’s say we want to find all the flow records going to IP address 10.0.55.91. This can be done by writing a search string where the field and the value we are looking for are separated by a colon:
dip:10.0.55.91
Here, "dip" stands for destination IP address.
Some other netflow tuple data fields are:
sip: source ip address
dip: destination ip address
sp: source port
dp: destination port
txB: transmitted total bytes
rxB: received total bytes
txP: transmitted numbers of packets
rxP: received number of packets
rf: a join value of received flags
tf: a join value of transmitted flags
start_ms: the starting time of the tuple session in UNIX millisecond time
prot: the protocol number
totalB: the total number of bytes sent and received
dur: length in milliseconds that the tuple session lasted
Fluency only relies on the tuple information for correlation, but all these fields are searchable. So, where is the magic if it’s so straightforward?
The magic is that outside of the tuple fields for Network Flows page, none of the other fields are defined, never mind required. Fluency is a schemeless database. This means that when data is parsed, the field names are defined completely by the parser.
This allows Fluency to be forward compatible with new data content that may appear in logs. Only Fluency and Elastic have this capability. It allows for searches to be available as soon as the new data is parsed.
Referring to Nested Fields
There are two reasons why having the code button (<>) is important. The first is that it lets you see all the fields that are available. The other is to see the structure of that field. Fluency stores its records in JSON format. JSON allows for other JSON objects to be part of its data. For example, the http JSON object in the example above contains more fields. When one object is inside the other, it’s referred to as nested.
In order for users to use field-value pairing to find the flows going to terplab.cloud.fluencysecurity.com, we need to list every parent field.
Using the Facet
Facet is a technical term used for groups of attributes; you can think of them as filters. The Facet Section covers this topic in more detail. Facets are an easy way to focus on data and see the most common responses by field.
Page last updated: 2023 Aug 10