Source Devices
Devices
This page shows the current devices exporting events to the Fluency Server.
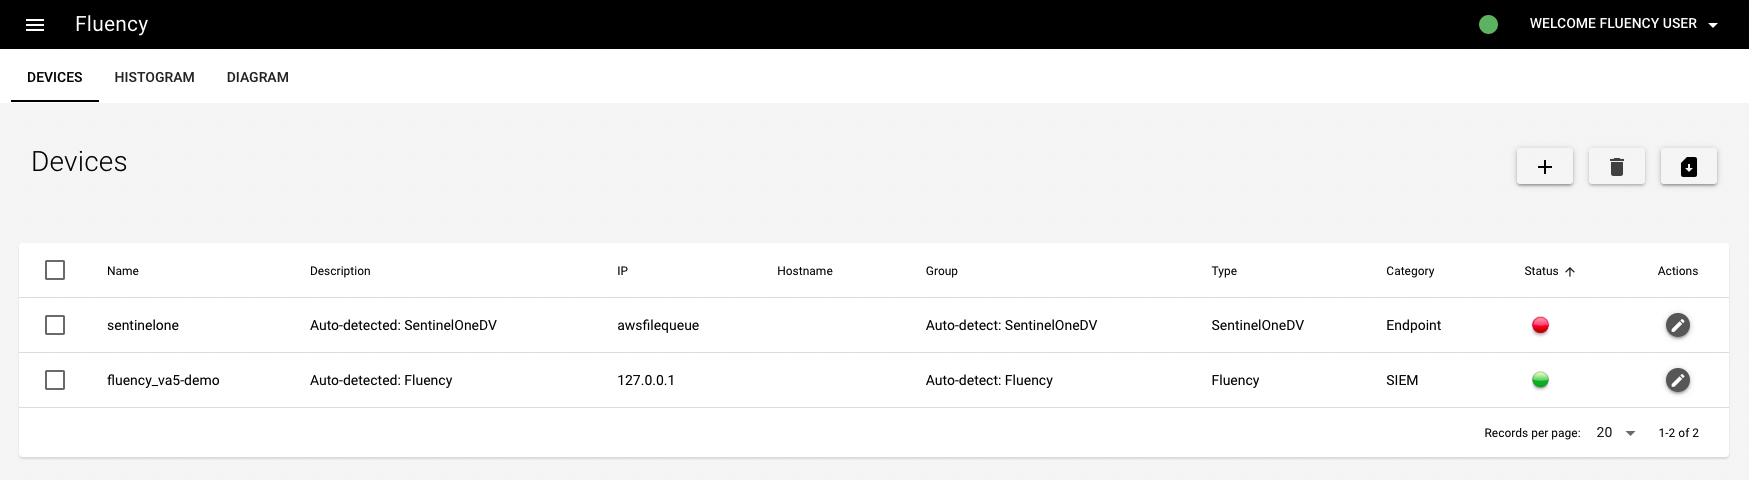
Each device must be manually added, with the IP address of the exporting device. For devices with entries, their exporting status will be monitored. The device's status is represented by a status light with three colors: green, yellow, and red. A green light indicates that the device is currently working. A yellow light indicates that the device has been offline; hovering over it will show how long it has been since the device was online. A red line indicates that the device is offline.
NOTE: When Fluency accepts log exports from another device, the assumption is that the device will send data at a constant rate, and not sporadically.
Additionally, an internal service in Fluency will monitor this status and generate notifications. A notification will trigger when Fluency does not receive data from a listed device for more than 1 hour.
There are other notifications (of varying severity), at the 4-hour and the 24-hour mark. If another notification for the same device is not generated after the initial 1-hour notification, then it can be assumed that the device resumed sending data to Fluency within 4 hours.
These notifications can be disabled by contacting Fluency support.
Fluency will also collected imported data for devices that are not listed on the above table. These devices, along with their source IP address (as seen by Fluency) can be found on the Histogram Tab.
Adding a Device
Click the "+" icon to add a device:
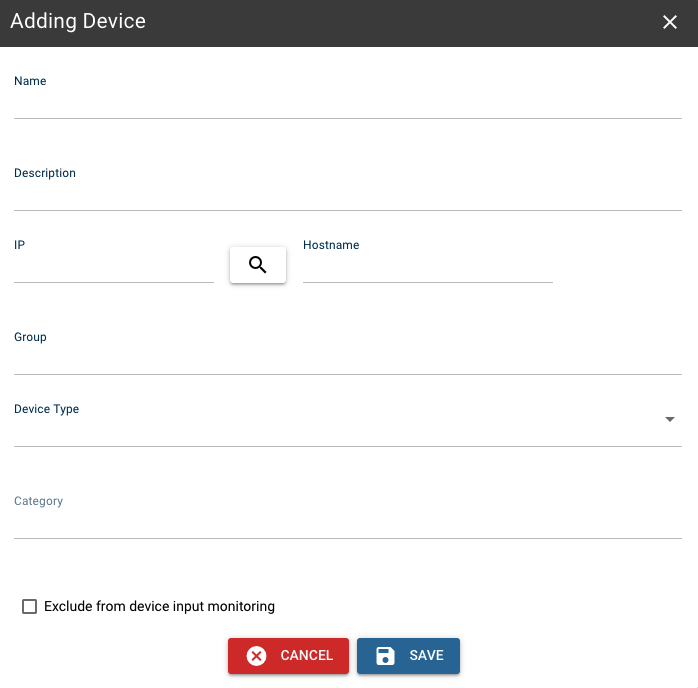
On this page, there are fields for name, description, IP, hostname, group and device type.
Once a device is added and associated with an IP address, the device will appear on the histogram with its associated name. Otherwise, the device's IP address will appear on the histogram.
Histogram
This tabs (second one) shows a figure of event count (per hour) pf all the devices (including the unassigned ones, see Unknown Sources). If these devices are not configured, they will appear on the histogram as their IP addresses.

The histogram will fail to load if there is no data for the histogram. This occurs when no data has been received in the last 7 days.
You can change the time range on the top right corner, and download the image by clicking the download icon.
Diagram
This tab shows an active sankey diagram of information flowing through the system.
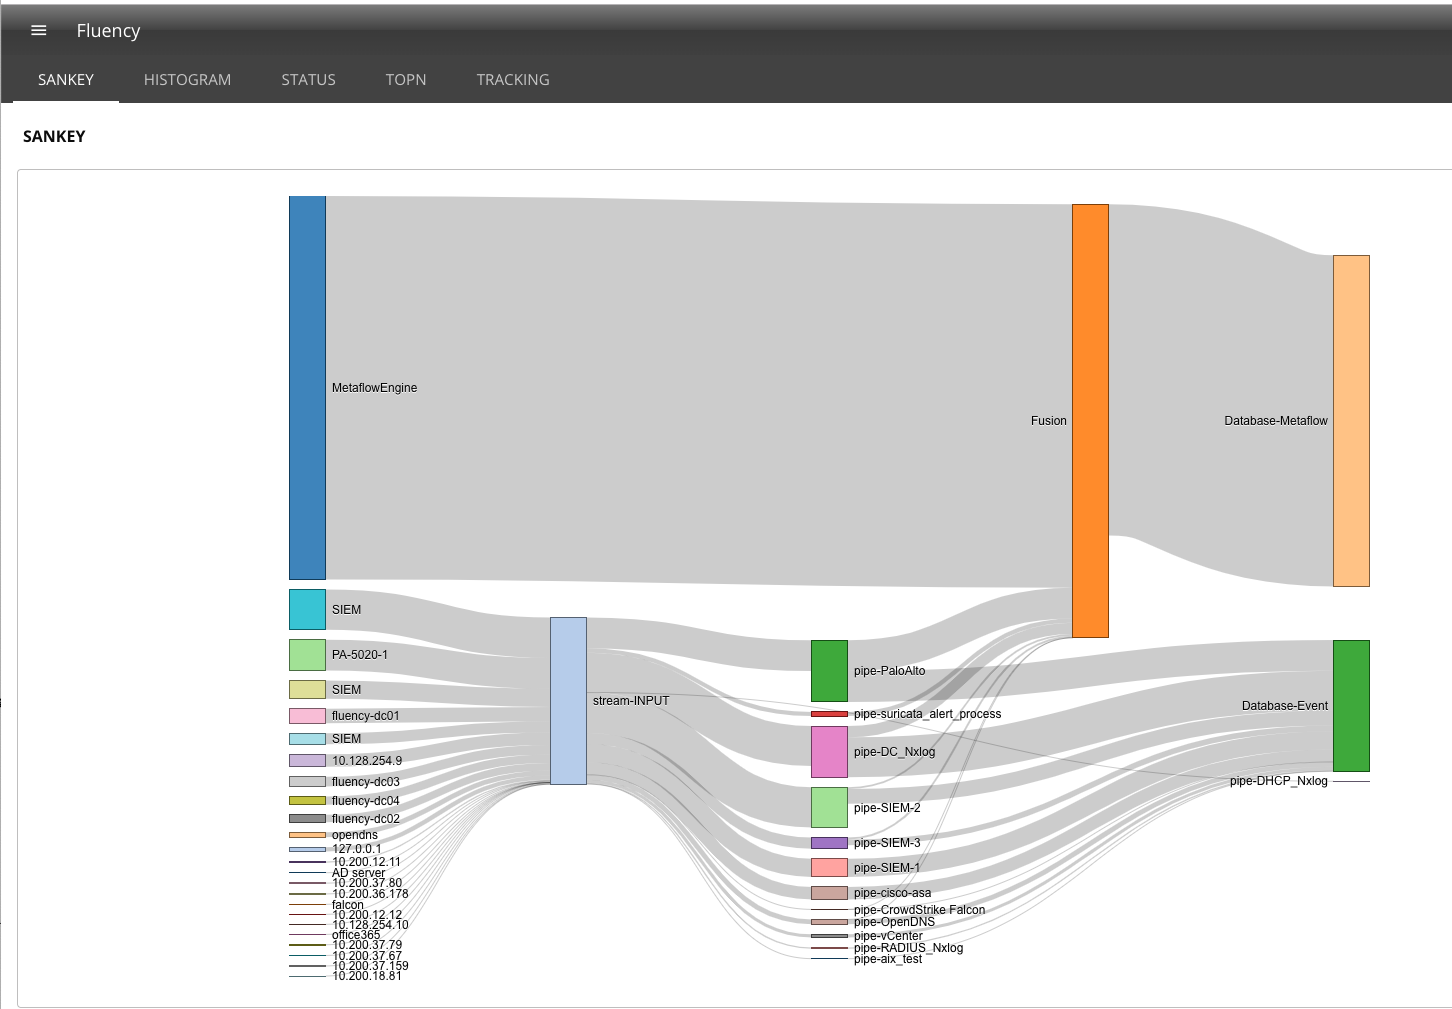
On the left side of the diagram is information entering the system.
Metaflow Engine data is the Fluency protocol analyzer adding flow data to fill in the gaps that are missed by the security tools. The boxes below that are data sources provide messages. The information is forwarded to the stream INPUT.
The message collector (stream INPUT) examines the message and sends it to the correct parser.
The parsers normalize the data into key-value fields producing a JSON document and define fields that are sensitive and have the value replaced with a Pseudonym.
The record and how the data is collected is placed in the Event Database and sent to the Fusion engine. The fusion engine enhances the record with table and third party lookups and merges the record with other records that share the same network tuple.
Before the record is stored, the RiskScore processor provides a confidence score and saved that data in the Flow Database.
Page last updated: 2023 Aug 02 18:25:55 EDT