Investigating a Behavior Alert
When a behavior alert is triggered, more information is often needed in order to determine whether the alert is a real hit or a false positive. This is easy to do using the Fluency interface, as you are able to easily pivot between places to dig deep into an alert.
First of all, behavior alerts can be viewed from Overview Summary option under the Overview section.
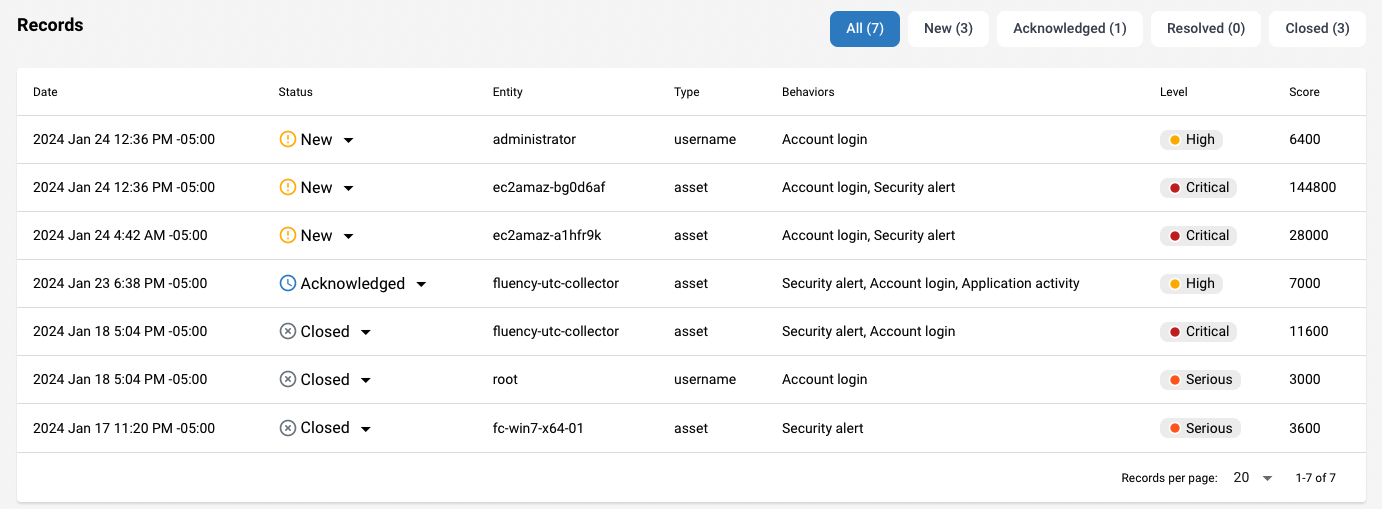
From here, you will be able to see key information, including date, status, entity, key, behavior type, level and risk score.
Taking the first record as an example with a high risk score and a risk level of "Critical" assigned, click this record and it will navigate to Behavior Summary page.
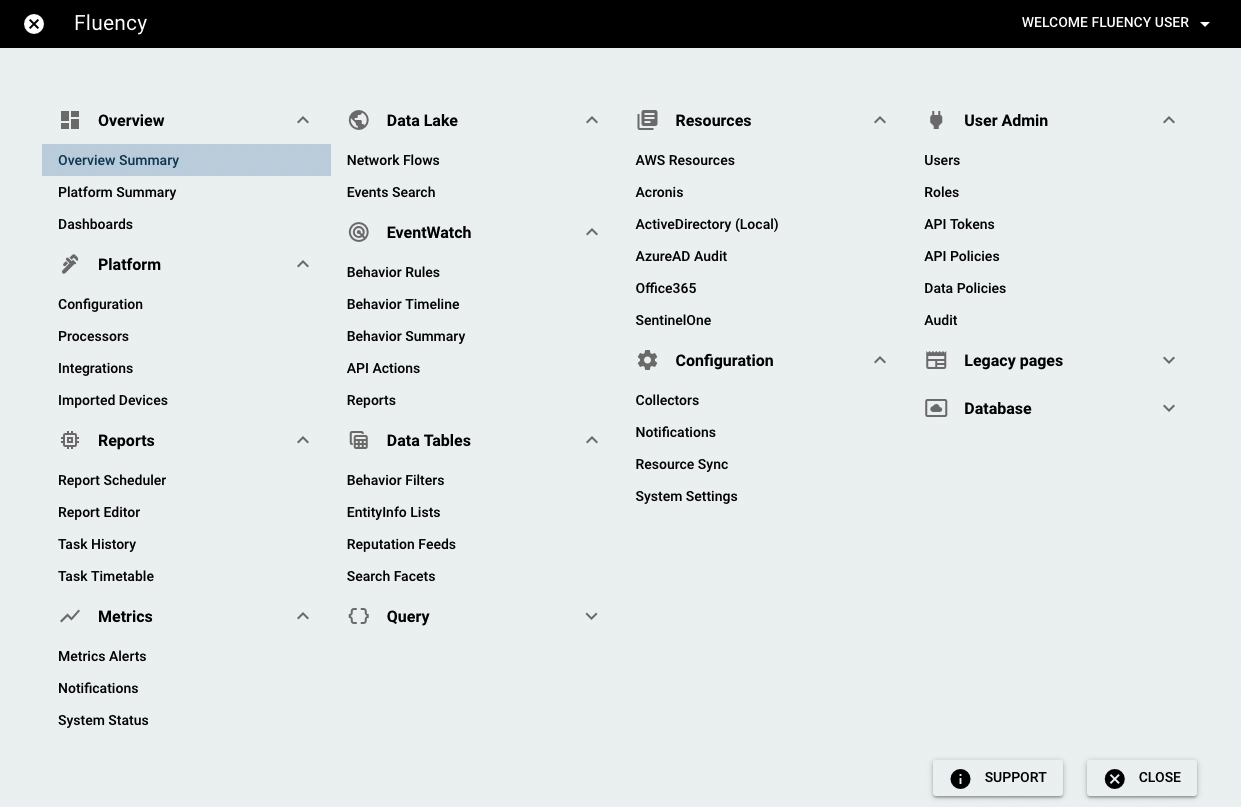
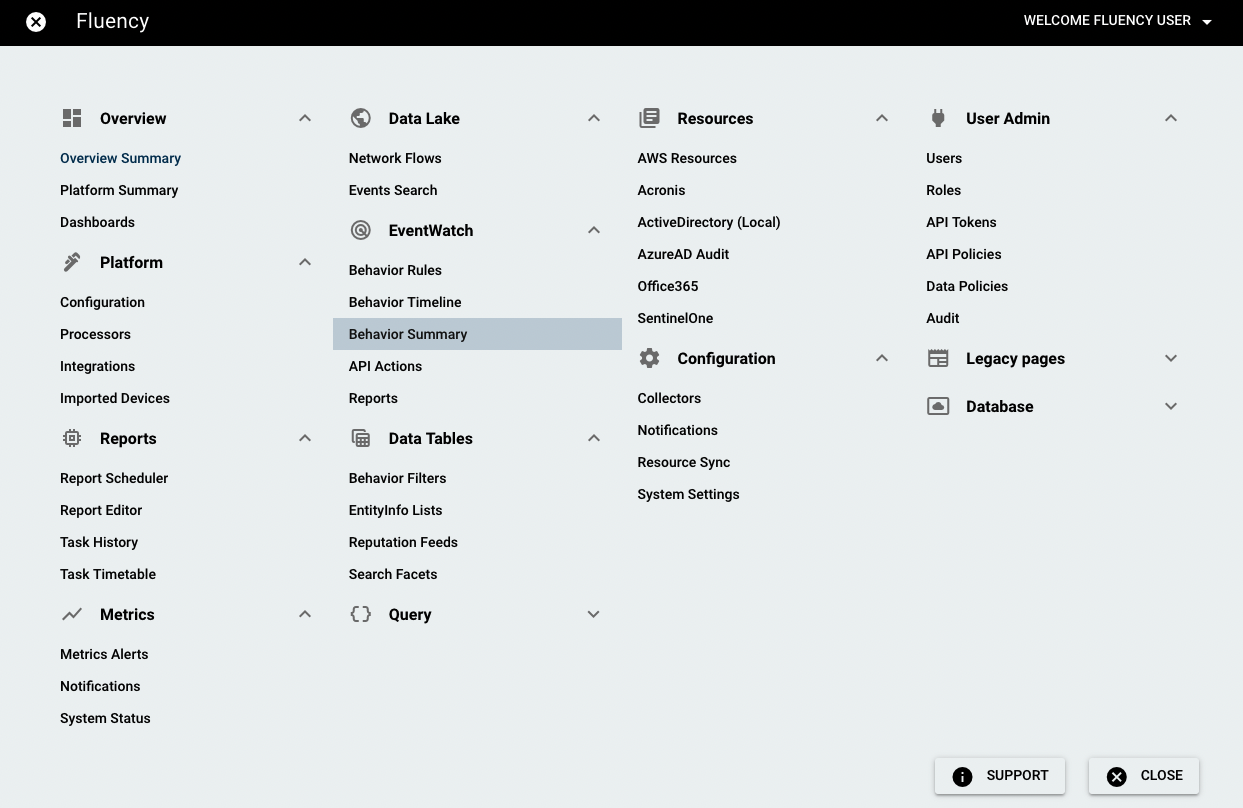
Note: You can also get to this page through the main menu like below, but it will show you all the behaviors.
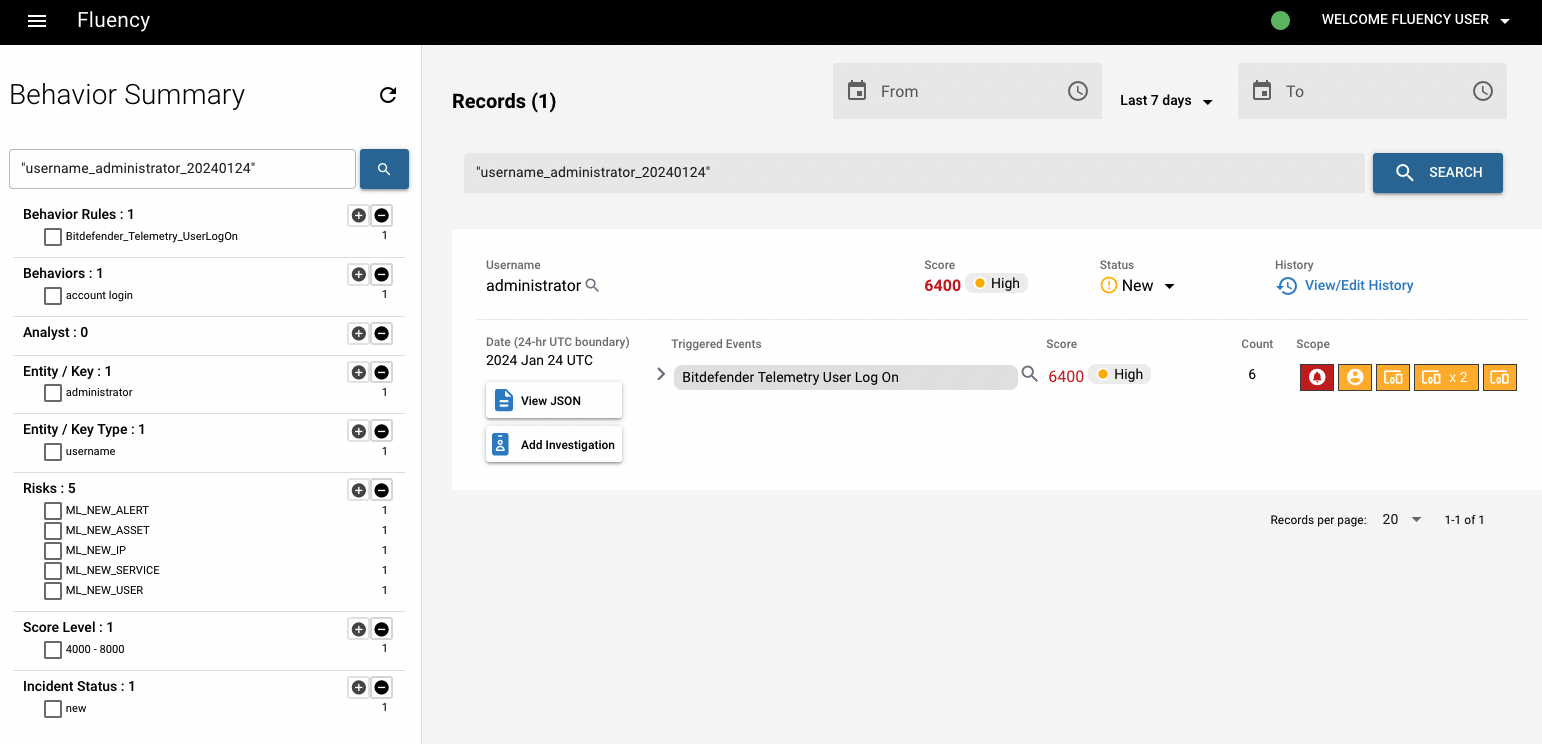
On the Behavior Summary page, we can see all the triggered events from this entity. To the right of that are the corresponding risk scores, in addition to the number of events that triggered them.
We're going click the magnifying glass icon next to the name of "asset" (Or you can also click the icon next to each "triggered events", to see the specific triggered event under this asset). The magnifying glass icons allow you to pivot to the Behavior Timeline page and dig deeper into the occurrences associated with the behavior alert.
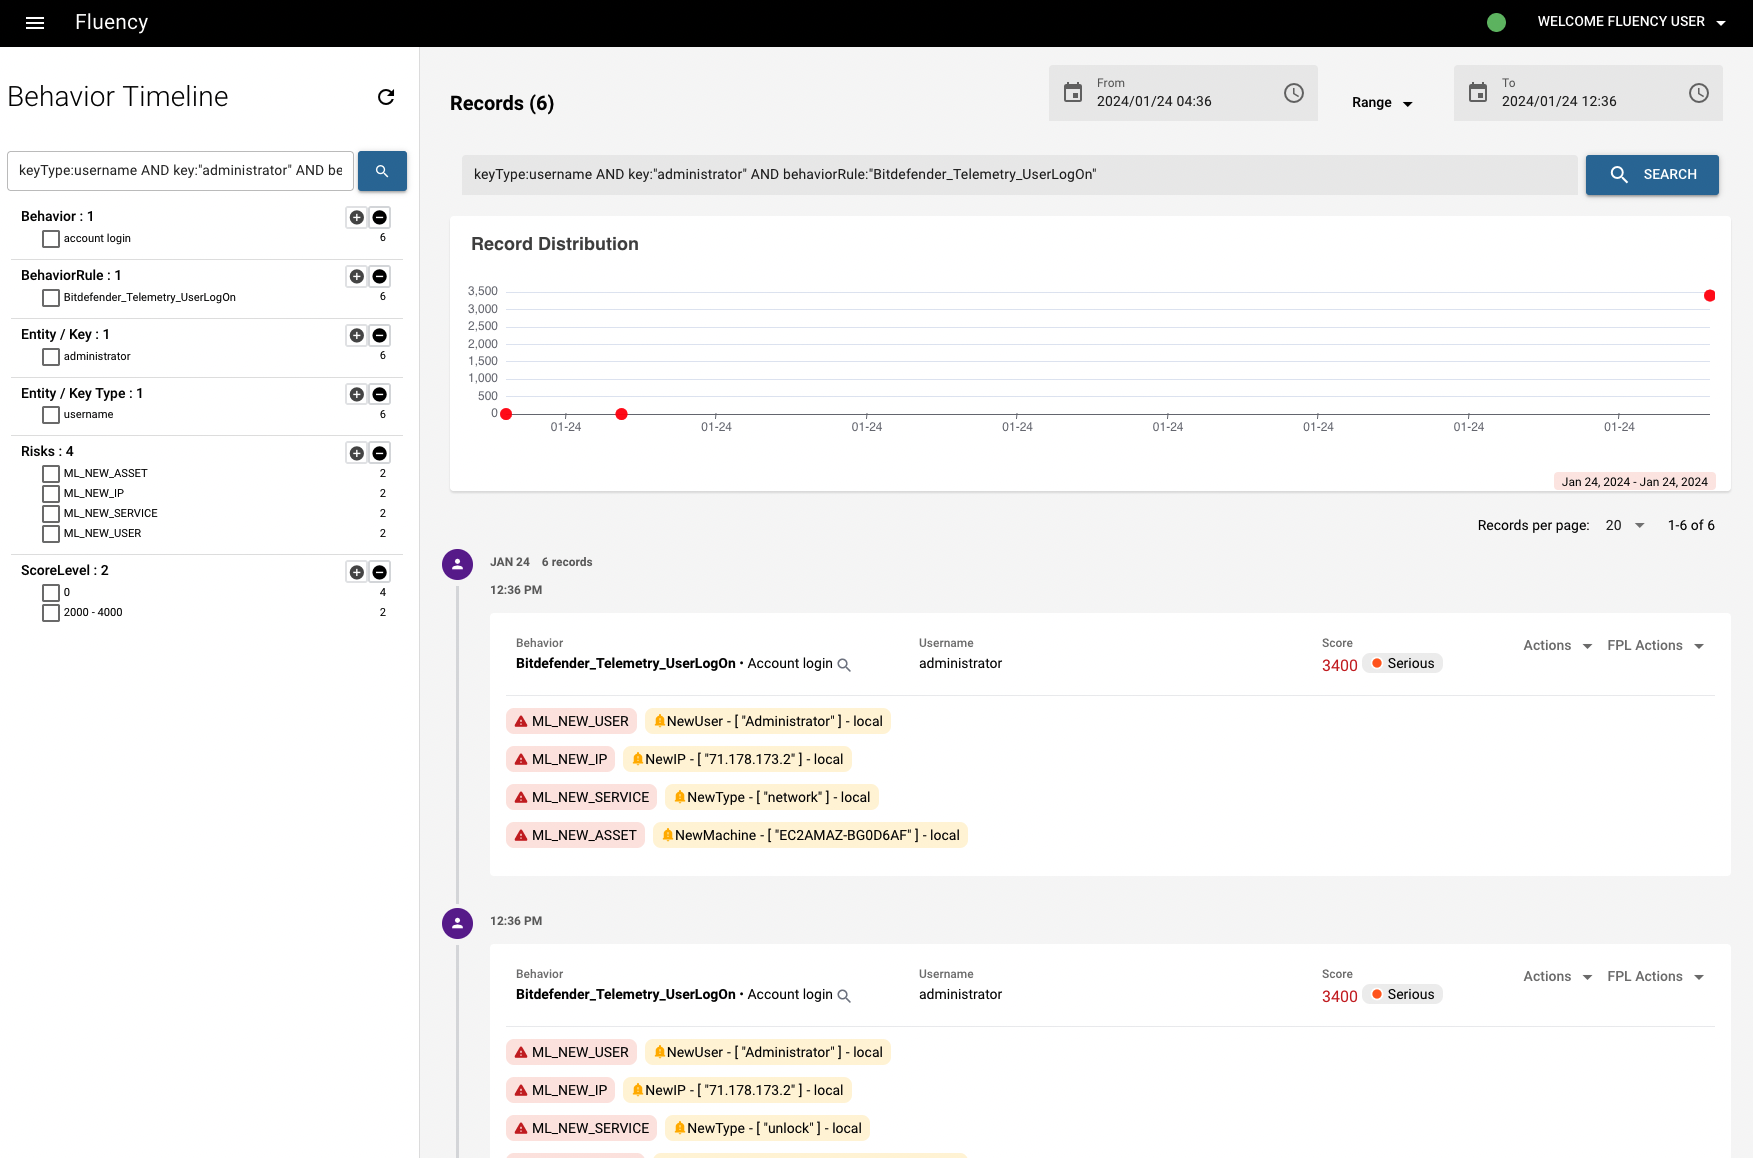
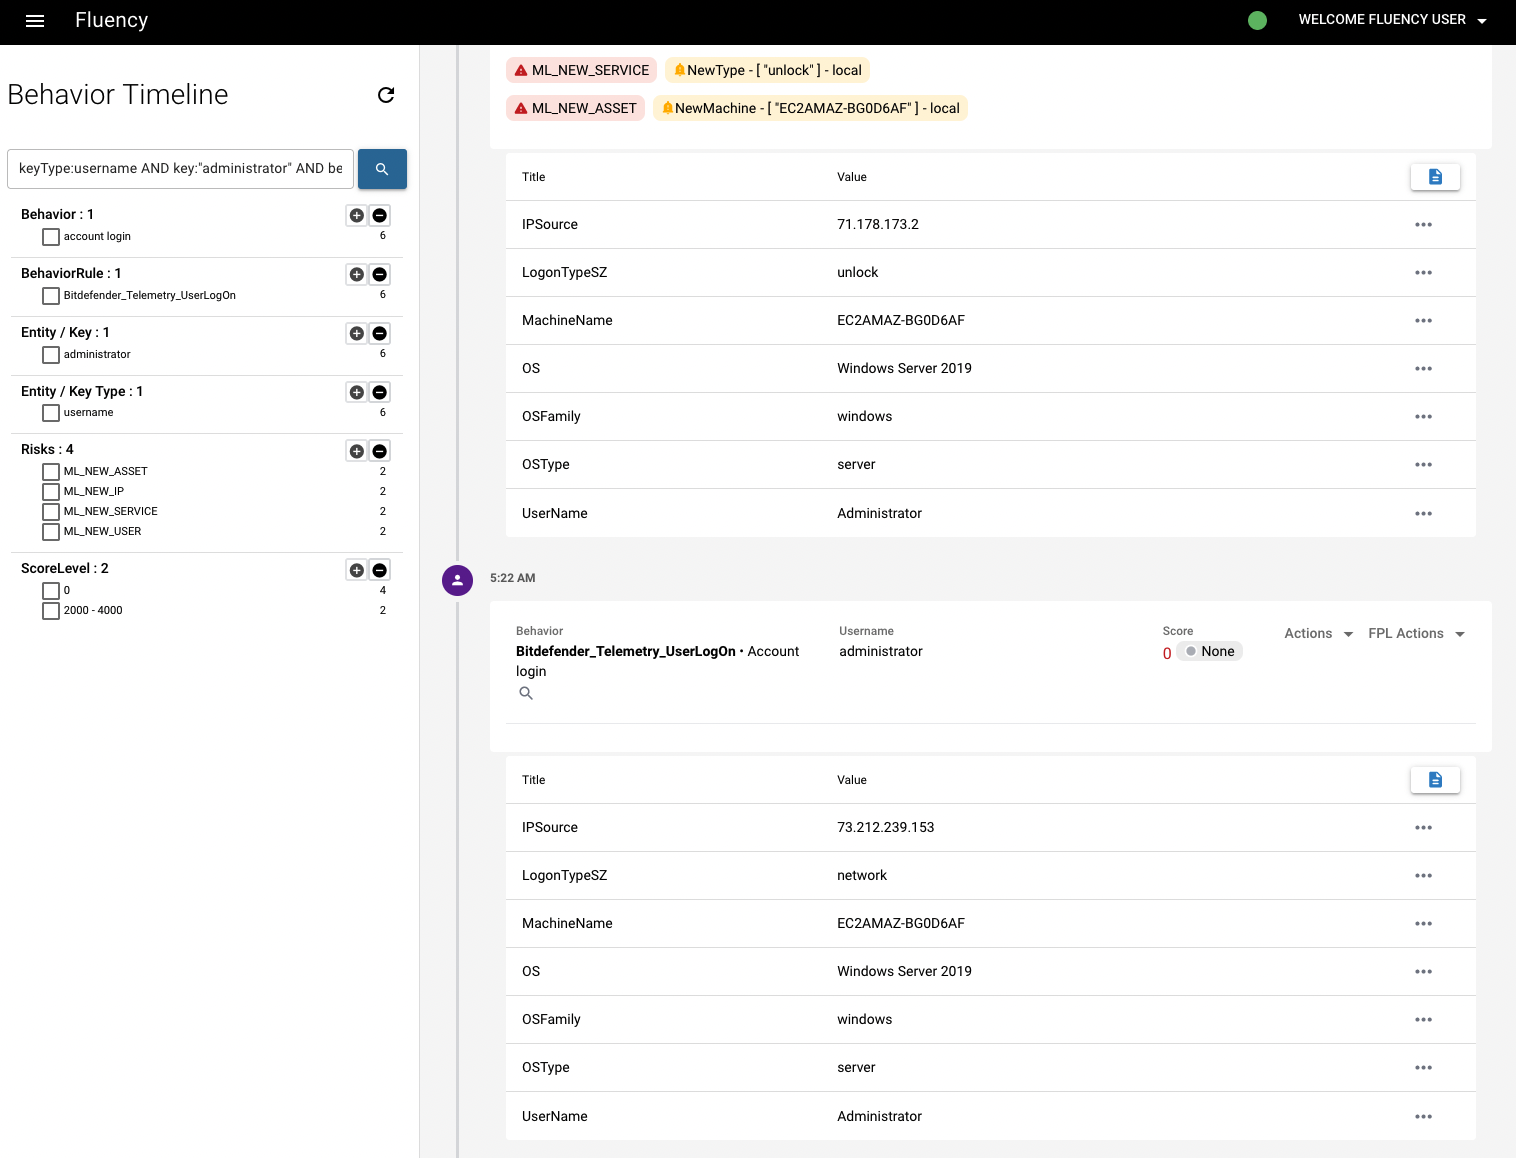
Pivoting to the Behavior Timeline page allows you to view all the behavior model hits that occurred in relation to the key type, depending on which record did you chose from the Summary page and which magnifying glass icon did you click from the Behavior Summary page. In this case, you can see the query is filled in with both the "keyType" (asset) and the "key" (the name of asset) in the search bar. Each of these summary hits can be expanded to view all the field data associated with it.
Note: You can also get to this page through the main menu as below. This will show you all the behaviors, not limited to the specific key type mentioned above.

Expanding all the records on the Behavior Timeline page, we can see that there are still limited information given, such as EventID, Hostname, etc.. Some crucial information that we'd like to know are missing, such as IP address.
To get the initial syslogs of this bahavior model, we're going to pivot to the Events Search page (Data Lake -> Events Search) using the magnifying glass by the behavior name. On the Events Search page, you'll see "@behaviors:"Bitdefender_Telemetry_UserLogOn" AND @bst.user_name:"Administrator"" are already filled in as the criterias of event search.
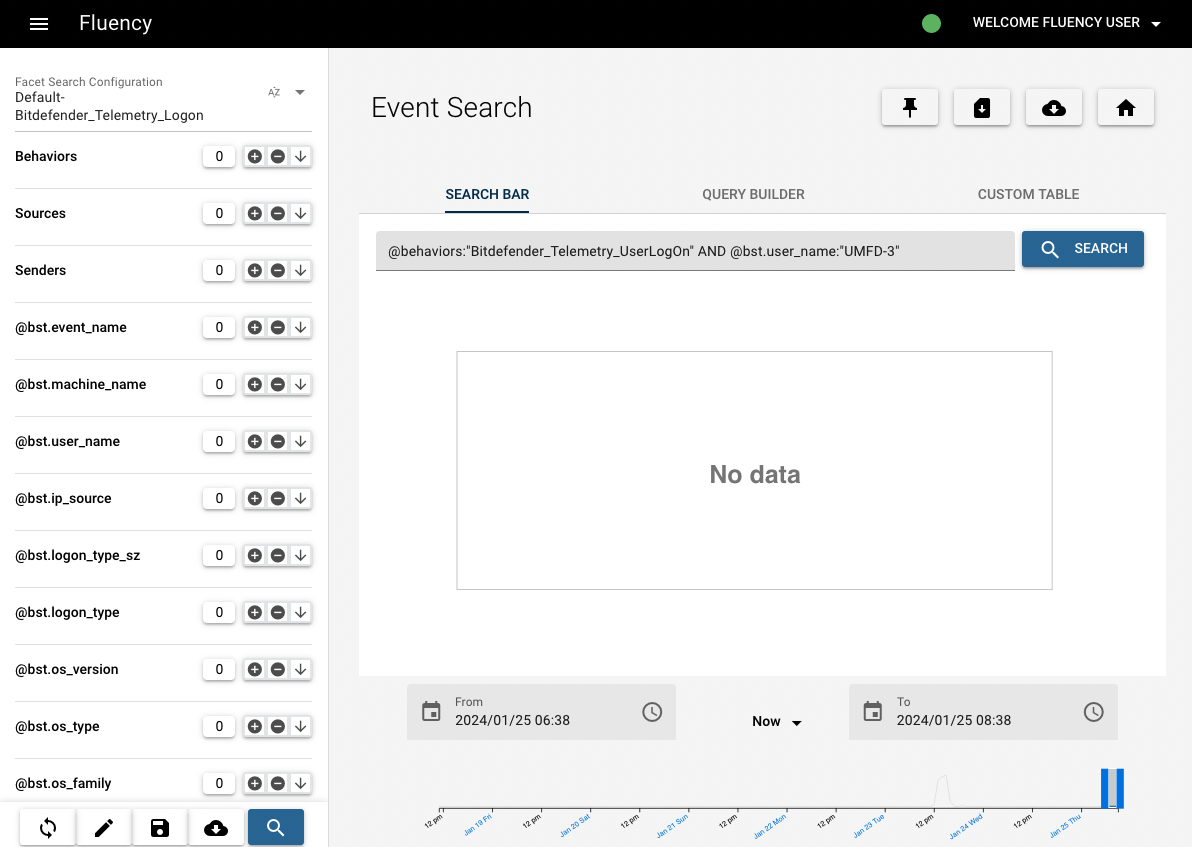
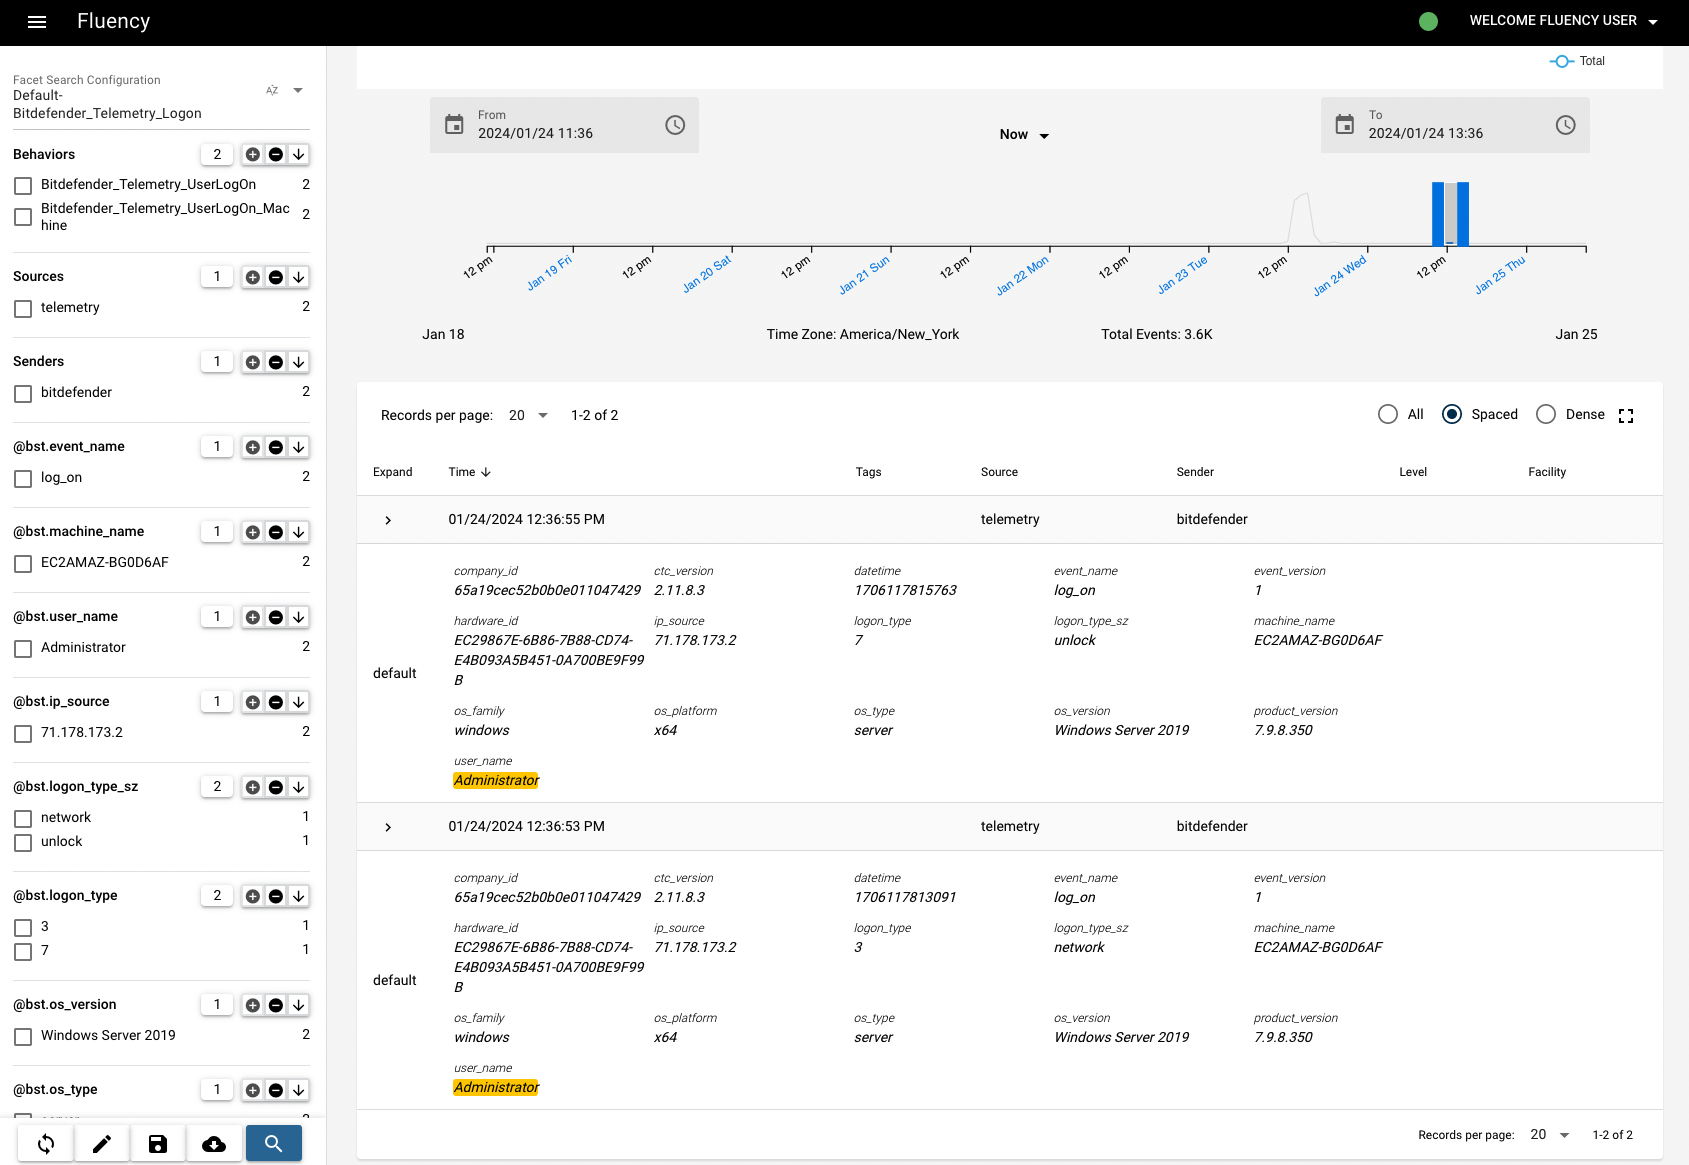
Click "search" botton to see the results.
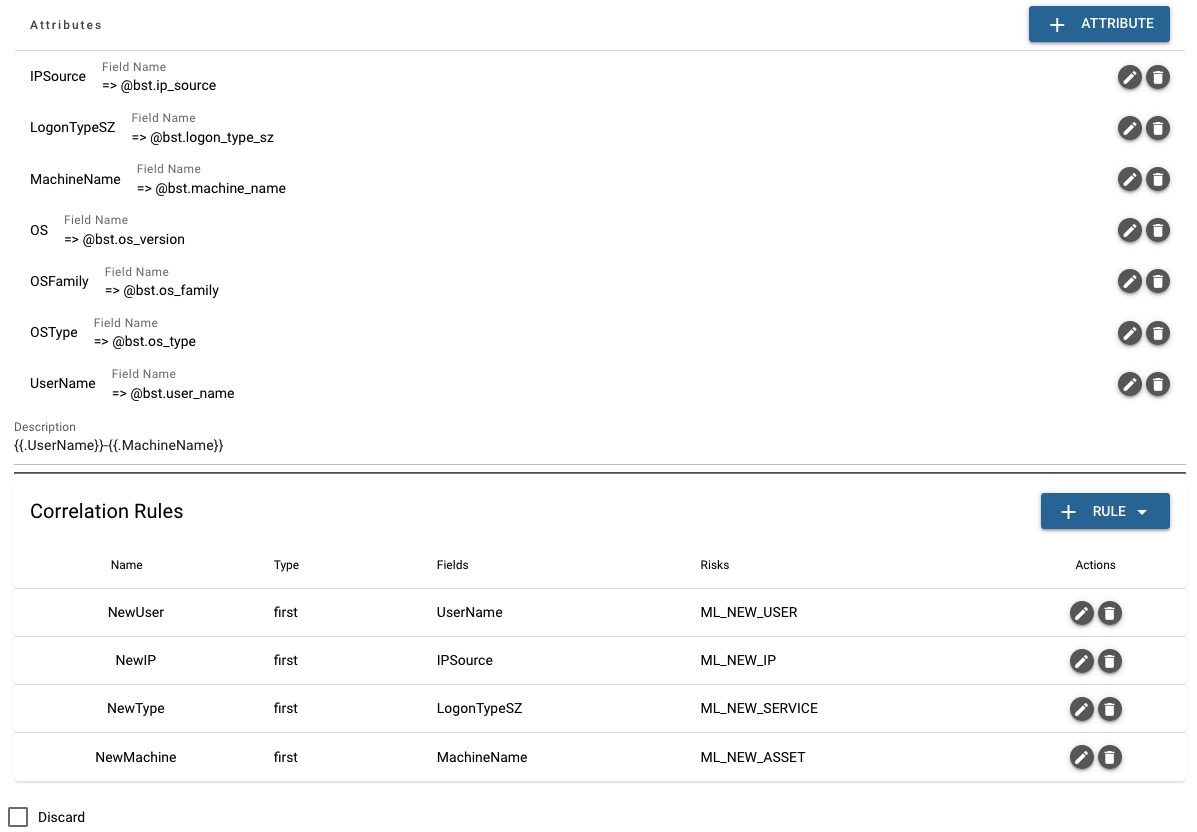
Before we investigate the syslog, go to the Behavior Rules page under EventWatch and search for the specific behavior ("Bitdefender_Telemetry_UserLogOn", in this case) to see what it refers to.
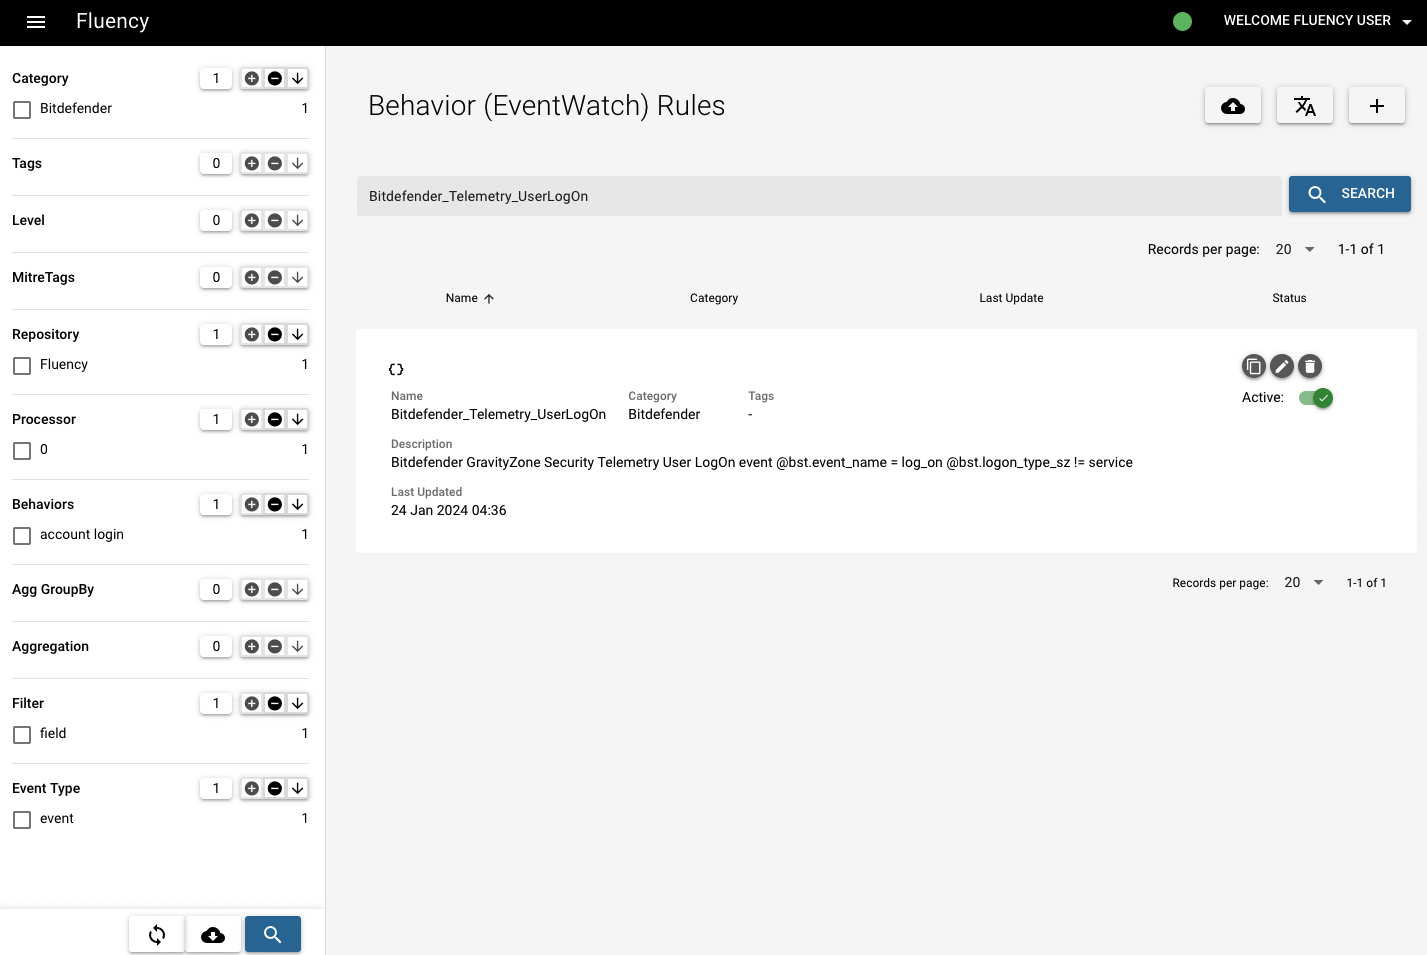
Click the pencil icon and continue to the third step "Activity Performed" (Refer to Creating a Behavior Model), then you can see this rule aims to give alerts for new logon, including the information of new user, IP, type and machine.
Then go back to the previous Behavior Timeline page and check the new user/IP/type/machine, you can see the record that has high score represents a new user who is different from the regular record (lower), and that's why this event triggered the alert.
Page last updated: 2023 Aug 09